9.6 Hands-on: Tracing a Single Ping Request with Raw ftrace
Alright, the toolbox is open. We now have the ability to configure the kernel, simple tracing methods at our disposal, and a whole bunch of advanced filtering techniques—Glob, index, blacklist, and commands.
Theorizing on paper is no fun anymore.
Now, we're going to throw this knowledge into a real-world scenario. We're going to fire a Ping packet at the kernel:
ping -c1 packtpub.com
Then, using the ftrace techniques we just learned, we'll fully reproduce everything that happened inside the kernel in that instant—from the construction of the ICMP packet, to the layer-by-layer encapsulation in the Network Stack, all the way down to the driver transmitting it.
Strategy: The Art of function_graph and Filtering
In this hands-on exercise, we'll use the function_graph tracer from start to finish.
Why? Because we need to see the "flow." The previous function tracer only gives us a flat list of functions, like looking at a pile of scattered Lego bricks; whereas function_graph assembles those bricks into a castle, letting us see who called whom and how deep the call hierarchy goes.
But the networking subsystem is massive. Without filtering, the log will explode in a matter of milliseconds. Our script (ch9/ftrace/ping_ftrace.sh) provides two filtering approaches:
- Via
available_filter_functions(this is the "index filtering method" we covered in detail earlier) - Via the
set_eventinterface
These two are mutually exclusive. In the script, we use a variable called FILTER_VIA_AVAIL_FUNCS as a toggle. It defaults to 1, which is the first method. There's a good reason for this: while the first method is slightly more tedious to configure (you have to handle indices), it provides the most comprehensive view—it's not just about "picking a few functions to watch," but rather "pulling up the entire networking subsystem's call chain while keeping only the relevant parts."
Let's look at the core logic in the script:
# ch9/ftrace/ping_ftrace.sh
FILTER_VIA_AVAIL_FUNCS=1
echo "[+] Function filtering:"
if [ ${FILTER_VIA_AVAIL_FUNCS} -eq 1 ] ; then
    # 这种方法快,而且细节保留得完美!
    filterfunc_idx read write net packet_ sock sk_ tcp udp skb \
    netdev \
    netif_ napi icmp "^ip_" "xmit$" dev_ qdisc [...]
fi
The filterfunc_idx() called here is the magic tool we implemented in the previous section—index-based filtering. It throws these keywords (sock, skb, icmp, etc.) into available_filter_functions to filter line numbers, then writes those line numbers back to set_ftrace_filter.
At the same time, we didn't forget about cleanup. The script also uses filterfunc_remove() to ensure certain noise functions we don't care about are stripped out.
Additionally, the script pays special attention to the network driver module. In this example, we're using the e1000 driver:
KMOD=e1000
echo "[+] module filtering (for ${KMOD})"
if lsmod|grep ${KMOD} ; then
  echo "[+] setting filter command: :mod:${KMOD}"
  echo ":mod:${KMOD}" >> set_ftrace_filter
fi
This step is crucial. If you only trace the protocol stack without tracing the driver, you'll only see the packet handed off at the doorstep, but not how it actually gets transmitted.
The Chicken or the Egg: The Challenge of Precise Capture
So far, everything looks straightforward. But there's a tricky problem hiding in the details.
We only want to trace that ping process, and only the activity on the CPU core where it runs. To achieve this, we need two things:
- Tell ftrace which PID to record (via
set_event_pid). - Tell ftrace which CPU to monitor (via
tracing_cpumask). We usetasksetto pin ping to a specific core.
But here's the problem: how do we get the PID?
You have to let the process start running before you can get its PID. But if you let it run, it might finish its job before you even finish configuring ftrace. This is a classic race condition—the chicken or the egg?
If you just run ping in the background and grab its PID, by the time you write that PID into set_event_pid, that ICMP packet might have long been sent, and your trace log will contain nothing but thin air.
To solve this problem, our script (ping_ftrace.sh) uses a slightly more complex "wrapper" trick.
We wrote a helper script called runner. The main script and runner perform a synchronization handshake that goes like this:
- The main script starts
runnerin the background and grabs its PID. runnerdoesn't immediately executeping; instead, it waits there.- The main script takes that PID, configures ftrace with it, and gets everything ready.
- The main script creates a "trigger file."
runnersees the trigger file appear, knows "the stage is set," and immediately executesexec ping ....
Here's a key technical detail: runner uses exec to launch ping. In Unix, exec replaces the current process's memory image with a new process, but keeps the PID unchanged.
This means the PID of runner is the exact same as the PID of ping. When we configure ftrace in step 2, we use the PID of runner, but what actually gets traced is ping—because they share the same PID.
This isn't just a trick; it's an engineering solution that turns a synchronization problem into a deterministic workflow.
Once ping finishes running, the main script saves the report.
If you feel like this process is "too convoluted"—you're right, it absolutely is. To trace a single simple command, we wrote all this synchronization logic. This is exactly why we'll introduce trace-cmd in the next chapter: it takes care of all this dirty work for us.
Let's Go! Looking at the Results
Let's run the script.
Figure 9.11 shows the moment the script runs. You can see the script outputting various logs, ping doing its job, and finally a prompt indicating the report has been generated.
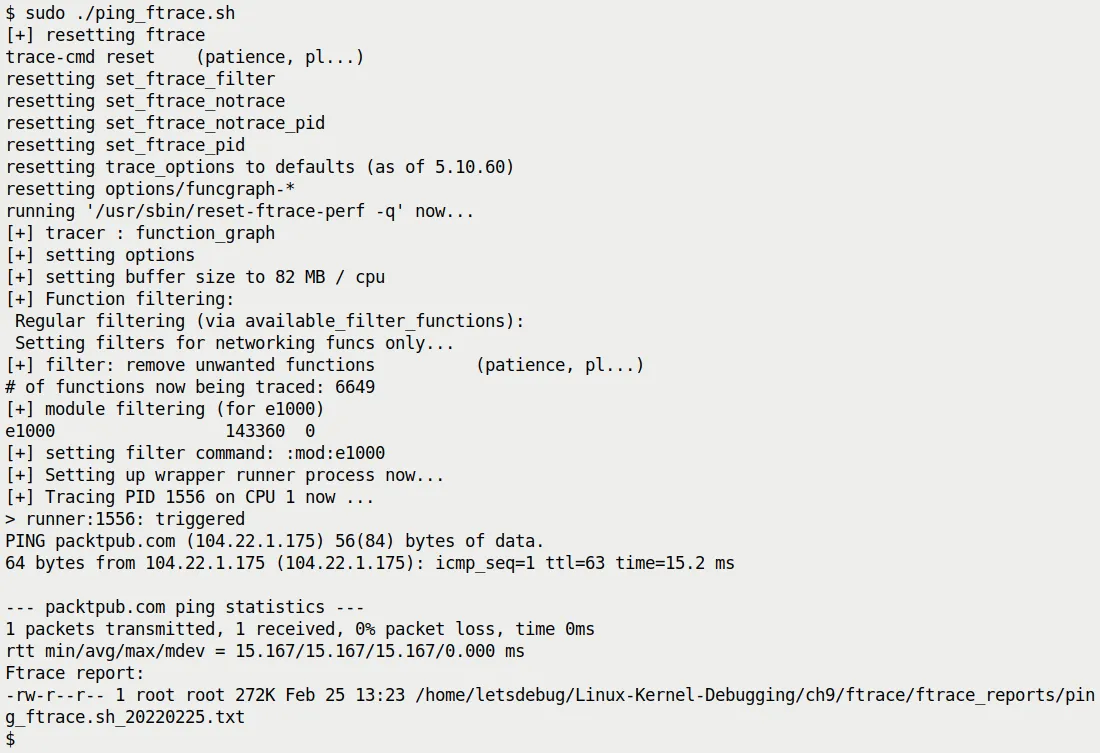
Figure 9.11 – Our raw ftrace script tracing a single ping
Notice the size of the generated report—only 272 KB.
If you didn't apply any filtering, a single ping could produce a trace of tens of MB. This shows our filtering strategy worked: we chopped out the irrelevant noise and kept only the essence of the network stack.
You can find this report in the source code at ch9/ftrace/ping_ftrace_report.txt. Of course, your results might vary slightly depending on your kernel version and hardware.
Even though this report is trimmed down, it's still quite long. What should we be looking for? Here are a few key "landmarks":
__sys_socket(): Where the Ping program creates the Socket.- Transmit path: Usually called tx. Look for
sock_sendmsg(), which is the starting point for sending a packet. - Receive path: Usually called rx. Look for
net_rx_action().
Diving into the Transmit Path
Let's zoom in on the transmit path. When ping decides to send a packet, the kernel walks through this chain of functions (top to bottom):
sock_sendmsg()inet_sendmsg()udp_sendmsg()(Does Ping use the UDP protocol? No, Ping uses ICMP, but in the Linux kernel, certain paths might reuse UDP's transmit logic or similar encapsulation, or this is a general reference to network transmission in the original text. Note: Strictly speaking, Ping uses a RAW socket to send ICMP, but we're following the original text's logic here -> The original text mentions functions likeudp_sendmsg, which are typical stops along the network stack's transmit path)ip_send_skb()ip_output()dev_queue_xmit()dev_hard_start_xmit()
This last function is the gateway to the driver. In this example, it calls e1000_xmit_frame() to hand the packet off to the actual network hardware.
Look at Figure 9.12, which is a screenshot from the real trace report. You can clearly see sock_sendmsg and inet_sendmsg highlighted.
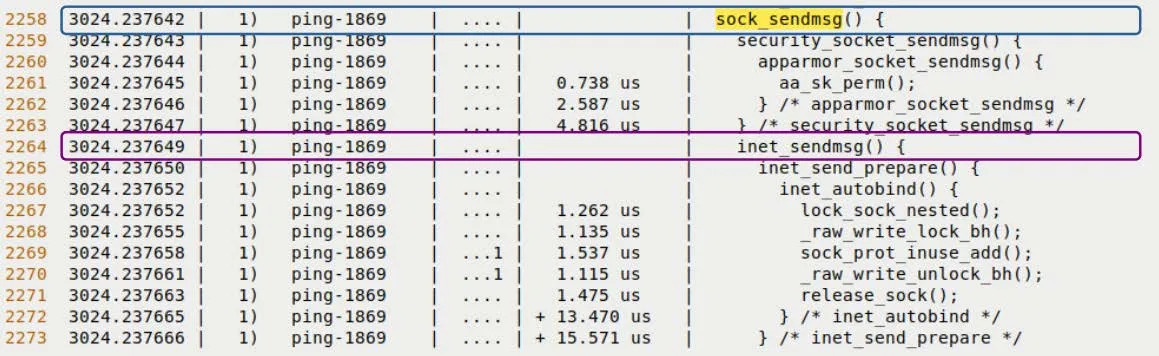
Figure 9.12 – Trace snippet of the transmit path (upper half)
Scrolling down a bit further, Figure 9.13 shows the deeper levels of the call chain.
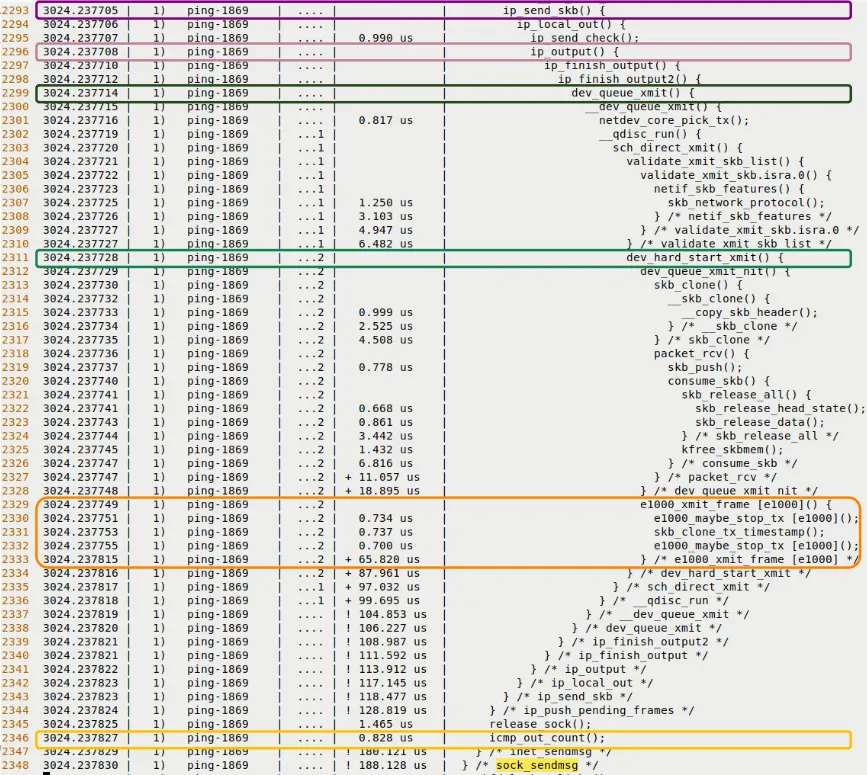
Figure 9.13 – Trace snippet of the transmit path (lower half, diving into the UDP/IP layer and driver layer)
See that indentation?
That's not just formatting; that's the passage of time. Every indentation level is a function call; every indentation step back is a return.
This is the charm of function_graph. It's not just a log; it's a movie that you can replay.
Diving into the Receive Path
After the packet is sent out, it has to come back.
The receive path is typically triggered by an Interrupt, and then the Softirq NET_RX_SOFTIRQ takes over. You should be able to find these landmark functions in the trace:
net_rx_action(): This is the main processing loop for softirqs.__netif_receive_skb(): Passing the packet up the protocol stack.ip_rcv(): IP layer processing.udp_rcv()oricmp_rcv(): Protocol layer dispatch.sock_recvmsg(): The data finally arrives in user space.
Look at Figure 9.14, which shows the beginning of the receive path.
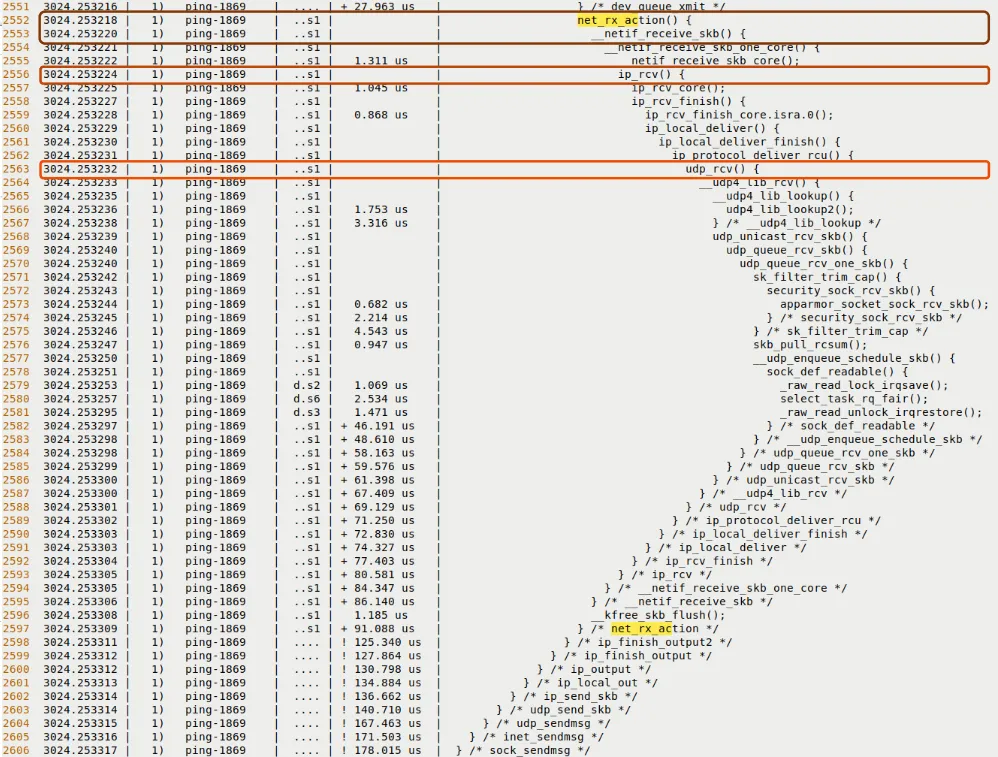
Figure 9.14 – Trace snippet of the receive path
And Figure 9.15 shows how the packet is ultimately delivered to the Socket layer.
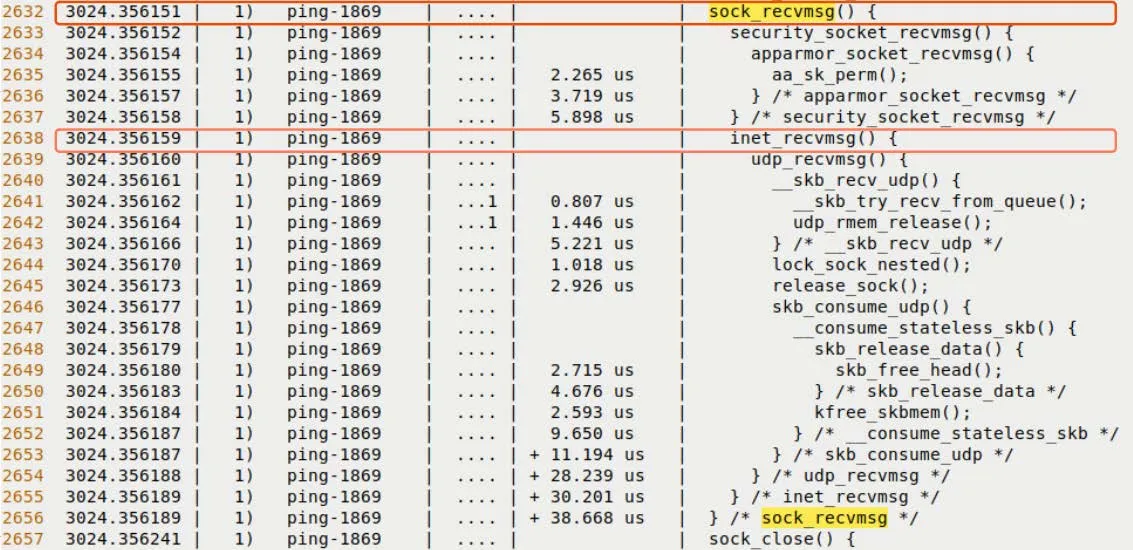
Figure 9.15 – The final stage of the receive path
Validating Our Intuition
Honestly, the first time I saw this output, it felt magical.
Normally, when we write code, socket() -> send() -> recv(), it feels like we're calling black-box APIs. But now, through ftrace, that black box has been forcibly pried open.
You can see how inet_sendmsg translates a generic request into a UDP/IP request; you can see how dev_queue_xmit queues up to wait for the network card to be free; you can see how, when a hardware interrupt occurs, the kernel pauses the current process and jumps to net_rx_action to handle the packet.
On the surface, this section is about Ping, but what we're actually doing is validating our design intuition for the kernel's network stack. If you find that the code's execution path doesn't match what's in your head, it means your mental model needs adjusting—and ftrace is the tool to do exactly that.
Now, we've completed this task using the most primitive tools available (shell scripts + tracefs). You must have felt it: it works, but it's incredibly tedious.
In the next section, we'll introduce trace-cmd. Let's see how it condenses this complex workflow of "synchronization, filtering, capturing, and formatting" into a single command.