7.3 The Devil in the Details — Anatomy of a Crash Scene
In the previous section, we deliberately triggered a kernel crash. Watching the Oops logs flood the screen was satisfying, but once the thrill wears off, the real question arises: what are all these hex codes actually saying?
If you just glance at them like a weather forecast, they look like gibberish. But if you want to be a kernel engineer, you must learn to read this information like a forensic examiner. Every field, every number, even every punctuation mark, is testimony left by the CPU.
To keep this from becoming an abstract theory lesson, let's dissect the "landmine" we just planted — Case 3: An Oops caused by writing to a struct member through a NULL pointer.
If you've already unloaded the module, no worries — just trigger the crash again:
cd ch7/oops_tryv2
make
sudo insmod ./oops_tryv2.ko bug_in_workq=yes
Unsurprisingly, the screen will spit out another large block of red error messages. Don't rush to clear the screen — that's the corpse we're here to dissect.
A quick note: The following content is architecture-specific. We'll use the x86_64 platform for our explanation, because the Oops output format varies across architectures. We'll encounter the ARM platform's format later on.
Line-by-Line Dissection of the Autopsy Report
To make things clearer, let's slice that long Oops screenshot into sections and examine them one by one. Think of it as categorizing the organs during an autopsy before inspecting each one individually.
Let's focus on the area marked 1 in Figure 7.7.
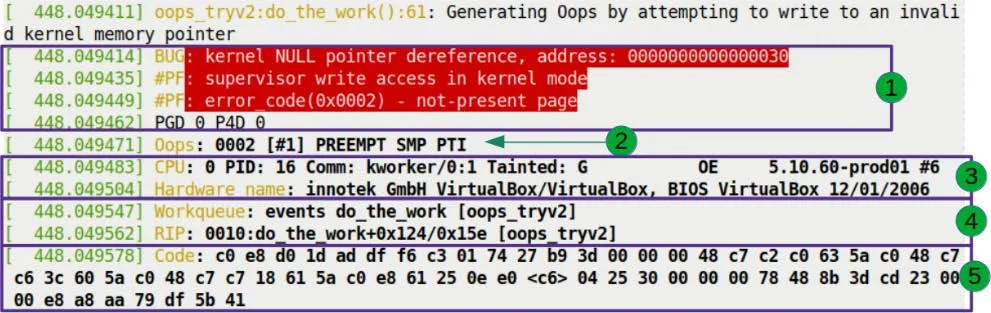
This is the first part of the Oops, and it sets the stage. The red background isn't meant to scare you — it's the default color scheme of dmesg for the pr_alert() log level. The kernel is using color to shout: "Something terrible happened!"
Let's break down these red lines one by one.
Line 1: The Verdict
BUG: kernel NULL pointer dereference, address: 0000000000000030
This line wasn't written — it was shouted by the kernel's fault-handling code.
This logic lives in the show_fault_oops() function in arch/x86/mm/fault.c. When the CPU triggers a page fault, the kernel jumps here to diagnose the issue. Let's look at the source code logic:
// arch/x86/mm/fault.c
static void
show_fault_oops(struct pt_regs *regs,
                unsigned long error_code,
                unsigned long address)
{
    [...]
    if (address < PAGE_SIZE && !user_mode(regs))
        pr_alert("BUG: kernel NULL pointer dereference, address: %px\n",
                 (void *)address);
    else
        pr_alert("BUG: unable to handle page fault for address: %px\n",
                 (void *)address);
See that? The if condition is the verdict.
- First check: Is the faulting address within the first page (
PAGE_SIZE, typically 4096 bytes)? - Second check: Were we running in kernel mode?
If both conditions are met, the kernel concludes: "This is a kernel-mode NULL pointer dereference." That's exactly what we see as BUG: kernel NULL pointer dereference.
Why 0x30 Instead of 0x00?
Here's a crucial detail that trips up many beginners.
Notice the faulting address: 0000000000000030.
If this were a pure NULL pointer, the address should be 0x00. Why the extra 0x30?
Let's go back to our malicious code:
oopsie->data = 'x';
oopsie is a struct pointer that we set to NULL without allocating any memory. But data isn't the start of the struct — it's a member inside it.
When we write oopsie->data, the compiler calculates that the offset of data within the struct is 0x30 (48 bytes in decimal).
So, the actual address the CPU accessed is: NULL (0x0) + 偏移量 (0x30) = 0x30.
This is why the faulting address in an Oops is often a strange small integer. When you see an address smaller than 4096 in an Oops, your reflex should kick in immediately: this is almost certainly a NULL pointer accessing a struct member or array element. That number is simply the distance it tried to cross.
Line 2: Scene Reconstruction
#PF: supervisor write access in kernel mode
This line also comes from the show_fault_oops() function. After printing the BUG type, it continues to decode the hardware error code:
pr_alert("#PF: %s %s in %s mode\n",
         (error_code & X86_PF_USER)  ? "user" : "supervisor",
         (error_code & X86_PF_INSTR) ? "instruction fetch" :
         (error_code & X86_PF_WRITE) ? "write access" : "read access",
         user_mode(regs) ? "user" : "kernel");
This line tells us three things:
- Supervisor: Running in supervisor mode (i.e., kernel mode) — a user program didn't cause this.
- Write access: It was a write operation that triggered the fault, not a read.
- Kernel mode: Confirms this happened in kernel mode.
Line 3: Error Code Decoding
#PF: error_code(0x0002) - not-present page
This is the final verdict from the MMU (Memory Management Unit). The error code 0x0002 was pushed into the register by the hardware; the kernel simply translated it into plain English.
The kernel's translation logic is as follows (still part of show_fault_oops):
pr_alert("#PF: error_code(0x%04lx) – %s\n", error_code,
         !(error_code & X86_PF_PROT) ? "not-present page" :
         (error_code & X86_PF_RSVD)  ? "reserved bit violation" :
         (error_code & X86_PF_PK)    ? "protection keys violation" :
                                       "permissions violation");
not-present page means: page not present. This makes sense, because the page containing address 0x30 has no physical memory mapped to it at all.
Reading the Architecture Fingerprint: The Oops Bitmask
Moving on, here's the key information on the second line (corresponding to Figure 7.8):
Oops: 0002 [#1] PREEMPT SMP PTI

The 0002 here is not the same as the error_code from earlier — it's the Oops bitmask. Although the values happen to be the same, their meanings differ. This is an architecture-specific error code, printed by the __die() function in arch/x86/kernel/dumpstack.c.
We can see its generation logic in the kernel source code:
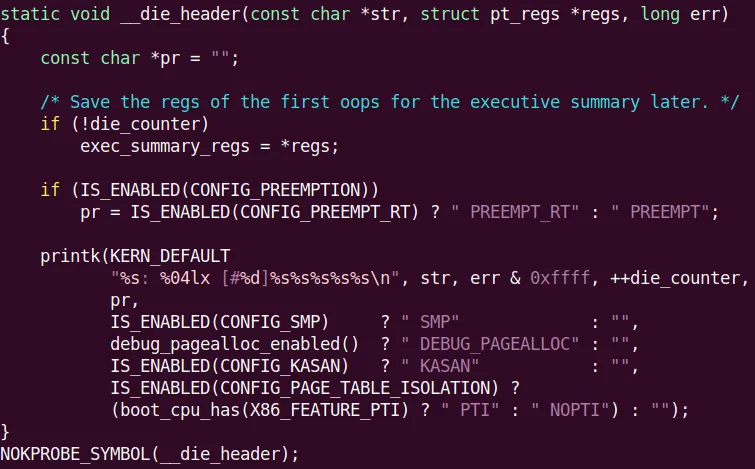
This string of numbers is like a CPU fingerprint. On the x86 architecture, when a page fault occurs, the MMU tells the kernel exactly what happened through a bitmask. This isn't just for the kernel — it's for you, too.
We need to learn how to read this mask ourselves. On x86, the 5 least significant bits (LSBs) have the following meanings:
| Bit | Value | Meaning |
|---|---|---|
| 0 | 0 | Page not present |
| 1 | Protection violation | |
| 1 | 0 | Read access |
| 1 | Write access | |
| 2 | 0 | Kernel mode |
| 1 | User mode | |
| 3 | 1 | Reserved bit violation detected |
| 4 | 1 | Fault was an instruction fetch |
Table 7.1 – x86 page fault error code bit meanings
Now let's match our 0002 (binary 00010) against this table:
- Bit 2 = 0: Kernel mode.
- Bit 1 = 1: Write access.
- Bit 0 = 0: Page not present.
A perfect match!
That's why the error message earlier said supervisor write access and not-present page. The entire truth was already encoded in this bitmask.
Regarding the rest of this line:
- [#1]: This is the first Oops since boot. The counter resets after a reboot.
- PREEMPT: The kernel has preemption enabled (
CONFIG_PREEMPT=y). - SMP: Symmetric multiprocessing support, meaning multi-core CPUs are active.
- PTI: Page Table Isolation. This is a security mechanism introduced to mitigate the Meltdown/Spectre vulnerabilities.
Locking Down the Suspect: Process Context and Taint Flags
The next two lines (corresponding to Figure 7.10) help us identify "who did it."

CPU: 0 PID: 16 Comm: kworker/0:1 Tainted: G           OE     5.10.60-prod01 #6
Hardware name: QEMU Standard PC (i440FX + PIIX, 1996), BIOS 1.14.0-2 04/01/2014
Process Identity
- CPU: 0: The disaster occurred on core 0.
- PID: 16: The process (or thread) ID is 16.
- Comm: kworker/0:1: The process name is
kworker/0:1.- Wait, this is important! This isn't the
bashwhere we typed the command, nor is it ainsmodprocess. This is a kernel thread. kworkeris the kernel's dedicated "worker" for handling asynchronous tasks. Our code was thrown into a workqueue, so the one actually executing it is this kernel thread.- Tip: If the Oops occurs in Interrupt Context, some of this information (like PID and Comm) may become unreliable, because interrupts don't belong to any specific process.
- Wait, this is important! This isn't the
Tainted Flags: The Kernel's "No Longer Pure" Declaration
Notice the string of characters after Tainted:: G OE.
The Linux kernel development community cares deeply about "purity." A "tainted" kernel means it's no longer in an officially supported, standard state. This usually happens when non-official, non-GPL, or unsigned modules are loaded.
This state is recorded by an 18-bit bitmask. You can decode these letters by referring to the table below:
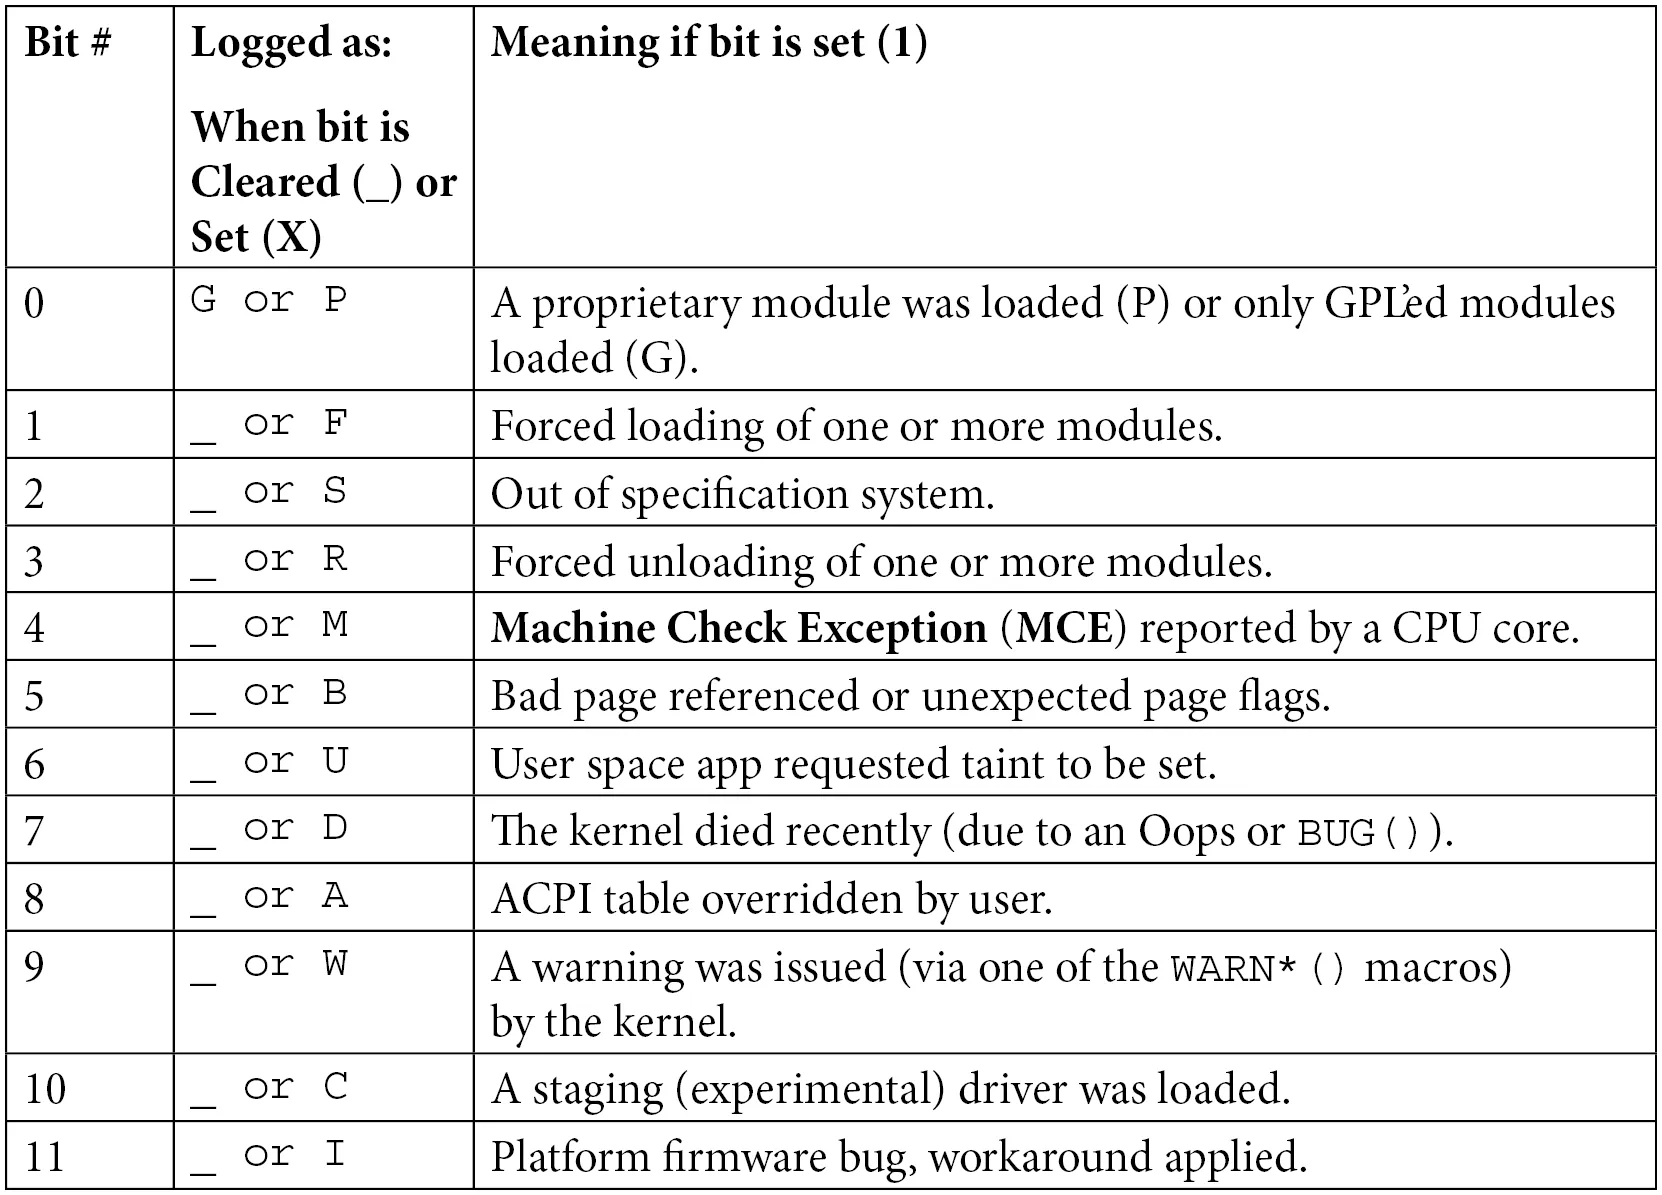
Table 7.2 – Kernel taint flag bit meanings quick reference
In our example:
- G (Bit 0): A GPL-licensed module was loaded.
- O (Bit 12): An out-of-tree module was loaded (i.e., not from the mainline kernel source tree).
- E (Bit 14): An unsigned module was loaded.
The underscores _ in the table indicate that those bits are empty. Note that in the Oops output, there are spaces between the letters — these precisely correspond to which bits are set to 1 and which are 0.
Our oops_tryv2 module perfectly matches all three characteristics: it declared a GPL license, we wrote it outside the kernel source tree, and it's unsigned.
Why does this matter?
When you submit a bug report to kernel developers, this is the first thing they check. If the state is Tainted, especially P (proprietary module) or F (force-loaded), they might just reply: "Stop using that closed-source garbage, reproduce it without it or goodbye." But if it's OE, at least it shows the module complies with GPL, and there's room for discussion.
Don't want to look up the table manually? There's a script in the kernel source tree that does it for you: scripts/debugging/kernel-chktaint.
Pinpointing the Location: RIP and the Crime Scene
The next few lines (corresponding to Figure 7.11) are the most critical part of the entire autopsy report — the exact coordinates of the crime scene.

Let's focus on this line:
RIP: 0010:do_the_work+0x124/0x15e [oops_tryv2]
This is the CPU's instruction pointer register — the exact line of code the CPU was staring at when it died.
Let's dissect this line like a bomb disposal expert:
- RIP: The instruction pointer register on x86_64, 64 bits wide. It holds the virtual address of the next instruction to execute.
- 0010: This is the segment selector. x86 still retains remnants of segmentation, and the code segment value is typically 0x0010.
- do_the_work+0x124/0x15e [oops_tryv2]:
do_the_work: The name of the faulting function.+0x124: The offset. This means the instruction is located0x124(292 in decimal) bytes past the function's start address./0x15e: Estimated function size. The kernel thinks this function is approximately0x15e(350 in decimal) bytes long.[oops_tryv2]: The square brackets indicate that this function belongs to a kernel module. If it were a kernel core function, there would be no brackets.
Reconstructing the Exact Location
This line tells us: the CPU was executing the do_the_work function in the oops_tryv2 module, and it crashed at byte 292.
This gives us the precise coordinates to find the culprit. But there's a pitfall we must warn you about:
Is the RIP always the root cause? Not necessarily. This is the hardest part of debugging. The location the RIP points to is where the symptom erupted; the true root cause (memory corrupted long ago, pointer overwritten) might have occurred thousands of lines of code earlier.
But in our example, it is the root cause. That infamous line of code is right here:
oopsie->data = 'x'; // 这里就是 RIP 停下的地方
Remember the Workqueue: events do_the_work [oops_tryv2] mentioned in the previous section? This log line (just above the RIP) confirms the context once again: our function was mounted on the kernel's default events workqueue for execution.
Machine Code and Registers: The Final Pieces of the Puzzle
Finally, let's look at the last two pieces of the puzzle: the machine code (Figure 7.12) and the register state (Figure 7.13).

Code: 48 c7 43 30 78 00 00 00 e8 1f e5 ff ff 48 89 ef 5d 41 5c 5d c3 0f 1f 44 00 00 48 8b 7b 30 48 85 ff 74 04 48 89 df e8 0b 50 00 00 <48> 89 43 30 e8 15 e5 ff ff 48 89 ef 5d 41 5c 5d c3
These are the raw machine instructions that caused the crash.
This is a hex byte stream. To an ordinary human, it's indistinguishable from gibberish. But the kernel has dedicated scripts (like scripts/decodecode) that can disassemble these bytes into readable assembly instructions and precisely mark which instruction faulted.
Tool Teaser Later, we'll cover how to use the
decodecodeanddecode_stacktrace.shscripts to automate the analysis of this content. Don't worry — the tools are right at hand.
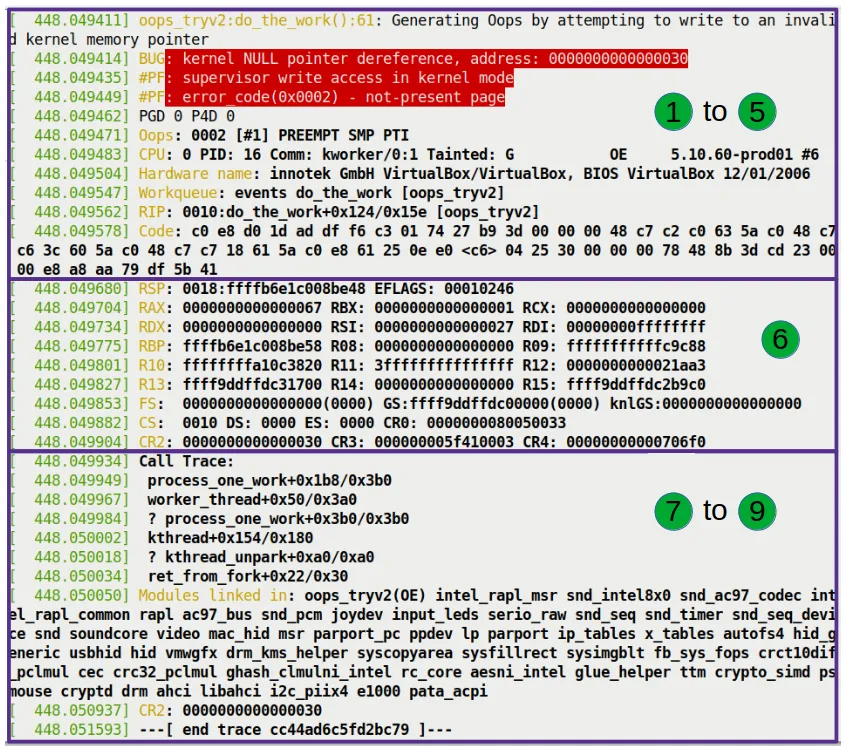
This register dump captures the CPU's inner state at that exact moment.
- RSP: Stack pointer.
0xffffb6e1c008be48. The kernel stack grows downward, so this is the top of the stack. - RAX, RBX, RCX...: Current values of the general-purpose registers.
- CR2: Pay attention to this control register!
- On x86_64, CR2 is specifically used to hold the linear address that triggered the page fault.
- In our example, CR2's value is exactly
0x30. - This is the "exhibit A." The CPU uses CR2 to point at your nose and say: "You accessed 0x30, and that's what caused this mess!"
About Deeper Evidence
The registers listed here are only from the top stack frame.
If you want to see the register values from all historical call stack frames, you'll need to bring out the heavy artillery — tools like kdump and crash. They can dump the entire memory for you, letting you travel back in time to replay the scene of every function call. We'll cover this in Chapter 12.
The Call Trace: Tracing the Disaster's Origins
The final section, and the most helpful one for debugging (Figure 7.14): the Call Trace.
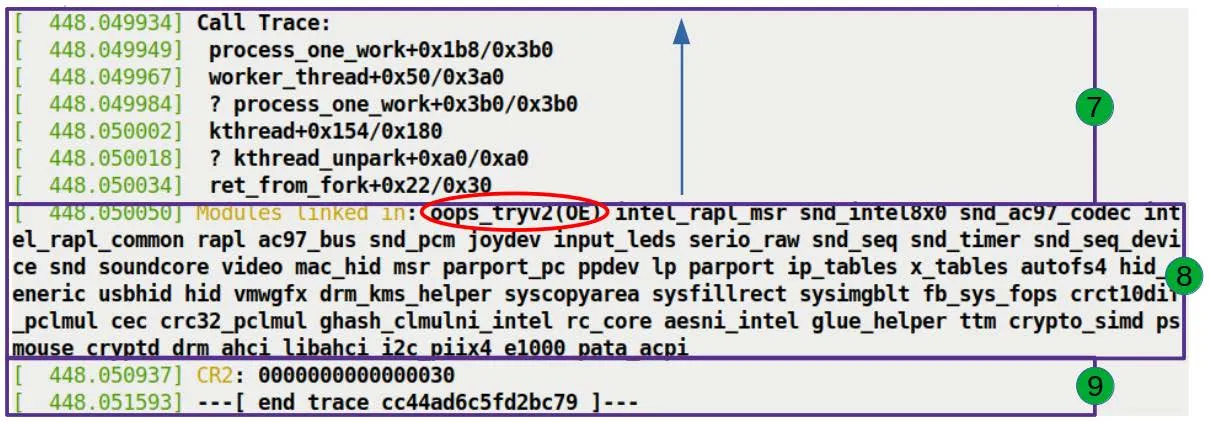
Call Trace:
 do_the_work+0x124/0x15e [oops_tryv2]
 process_one_work+0x1a7/0x360
 worker_thread+0x4d/0x3f0
 kthread+0x12b/0x150
 ret_from_fork+0x22/0x30
This is the kernel's "black box." It completely records how the CPU一步步 walked into the trap.
Reading Rules
-
Read from bottom to top: Because the stack grows downward, the bottom-most entry is the earliest called function.
-
Ignore the question marks: If a line begins with
?, it means the stack unwinding algorithm considers that part unreliable — it might be leftover data from previous calls. The kernel's stack unwinding algorithm is smart, but it isn't infallible.
Decoding Our Call Trace
Let's reconstruct what happened:
- ret_from_fork: The generic entry point after a kernel thread is created.
- kthread: The standard mechanism for kernel thread creation.
- worker_thread: The consumer thread for workqueues, whose job is to continuously process tasks from the queue.
- process_one_work: The internal implementation of
worker_thread, which calls this function to handle a specific work item. - do_the_work: Our function!
process_one_workcalled it.- Right here, we tried to write 'x' to
NULL + 0x30, triggering the page fault.
- Right here, we tried to write 'x' to
The entire chain is crystal clear: the kernel thread was forked, entered the work loop, picked up our task, executed our function, and crashed.
Who Else Was Present?
Below the call trace, there's another line:
Modules linked in: oops_tryv2 ...
This lists all modules loaded in the system at the time. Unsurprisingly, our oops_tryv2 sits at the top of the list, since it was just loaded. And the OE taint flag here once again confirms its "outlaw" status.
Finally, we see the CR2 value one more time:
CR2: 0000000000000030
The kernel places this most important piece of evidence at the very end, serving as the closing argument for the entire autopsy report: this is the address you're looking for.
With that, the dissection of the crash scene is complete. Did you notice that this seemingly chaotic log is actually telling you a story with every line? The kernel may be tight-lipped, but it never lies.