9.3 Configuring the Kernel for ftrace Support
Most modern Linux distributions come with ftrace support enabled out of the box.
This makes perfect sense—when something goes wrong, you want a tool ready at hand rather than stumbling around blindly. In the kernel configuration, this master switch is called CONFIG_FTRACE, and it is typically already set to y. If you prefer the graphical make menuconfig, you can find the "Tracers" menu under "Kernel hacking".
However, enabling this option has a prerequisite: TRACING_SUPPORT.
This is architecture-dependent (CPU type) and must be y. In practice, most common architectures (x86, ARM64, etc.) already satisfy this dependency. To give you a concrete idea, here is a screenshot of the configuration on a 5.10.60 kernel for x86_64:
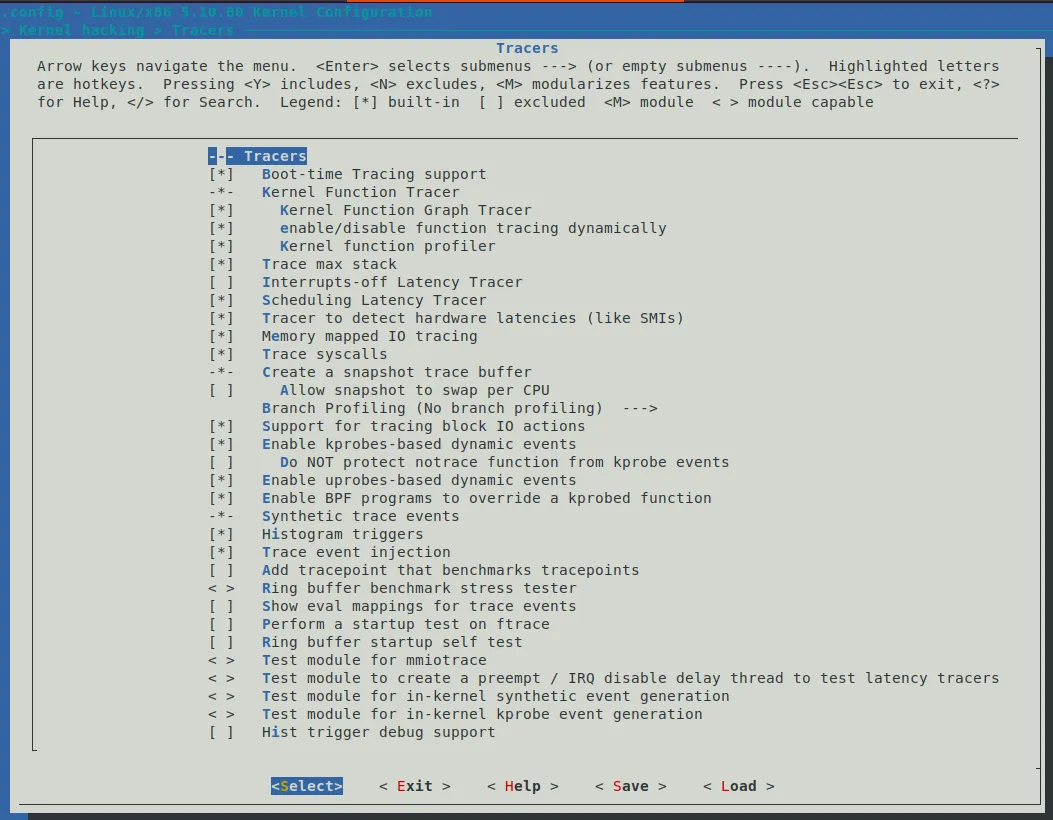
*Figure 9.3 – Screenshot of the Tracers submenu on x86_64 (5.10.60) with default options
Beyond the master switch, some specific tracers have their own dependencies. For example, to enable the "Interrupts-off Latency Tracer" (CONFIG_IRQSOFF_TRACER), you need TRACE_IRQFLAGS_SUPPORT=y (which is also typically enabled by default; we'll dive into these latency-specific tracers in the FAQ chapter later). Additionally, many options require the ability to display kernel stack traces (CONFIG_STACKTRACE_SUPPORT=y), but fortunately, these are standard in modern kernels.
If you want to dig into the details, all ftrace-related submenus and configuration options are defined in the kernel/trace/Kconfig file in the source tree. You can look up the descriptions of any options that interest you there.
Is ftrace Actually Enabled on Your Kernel?
Enough theory—let's tackle the practical question: is ftrace enabled on your system?
If you're running a general-purpose distribution like Ubuntu 20.04.3 LTS, the answer is almost certainly yes. We can verify this:
$ grep -w CONFIG_FTRACE /boot/config-5.11.0-46-generic
CONFIG_FTRACE=y
There you go—it's y.
But what if you're working on an embedded project? That's harder to say. Go check your project's kernel configuration file, or simply grep it. On the custom 5.10.60 production kernel I work with, it is enabled.
On a related note, the technical reviewer for this book, Chi Thahn Hoang, has extensive experience in embedded Linux. He shared a crucial insight: in every project he has worked on, ftrace is always compiled into the kernel. Why? Because even though you don't use it day-to-day, it's an absolute lifesaver when the system goes wrong. Moreover, as long as you don't "turn it on," its overhead is exactly zero.
This brings us to the next question: overhead.
Ftrace and System Overhead
You might be thinking: "Even if I don't turn it on, as long as the feature is there, there must be some performance cost, right?"
This intuition is both right and wrong. If ftrace were a simple "on/off" switch, the code would indeed need to litter every function entry and exit with conditional logic like this:
if (tracing_enabled) {
    // 做跟踪记录的事情
}
If that were the case, even when you aren't tracing, every function call would incur an extra if check. In a kernel where every nanosecond counts, this overhead would be unacceptable.
But the kernel developers came up with a brilliant (and slightly crazy) solution.
This configuration is called CONFIG_DYNAMIC_FTRACE (dynamic ftrace).
When enabled, the kernel does something astonishing at runtime—it directly modifies the machine code in memory. When tracing is off, it replaces the instruction at the function entry point with NOP (a no-op), which does absolutely nothing and incurs zero performance cost. When you need to trace a specific function, it dynamically replaces that instruction with a jump to the ftrace handling code (a mechanism commonly known as the Trampoline).
Therefore, by default, this option is enabled. This means:
- When not tracing, performance is native.
- When tracing a small number of functions, performance is near-native.
- Only when tracing all functions at full speed will there be a noticeable performance drop.
Now, let's get to the main event. Assuming your kernel is properly configured, we'll jump straight into the /sys/kernel/tracing directory and start flipping those control switches.
Note: The following operations require root privileges. If you are not the root user, many files will be read-only or completely inaccessible.
# cd /sys/kernel/tracing
(This is the first time we're explicitly spelling out this path. Note the # prompt, which indicates we are running as root; you'll need to sudo -s or prepend sudo to every command.)
The tracefs filesystem contains many control knobs (all pseudo-files, of course, just like procfs and sysfs). Among them is a file named tracing_on, which controls the actual on/off switch for the tracing functionality.
# ls -l tracing_on
-rw-r--r-- 1 root root 0 Jan 19 19:00 tracing_on
What is its current value?
# cat tracing_on
1
It's 1. This is intuitive—0 means off, and 1 means on.
Wait, ftrace is enabled by default? Won't that impact performance?
Don't worry—there's a subtle detail here. Although tracing_on is 1, ftrace is actually in a "standby" state.
You can think of tracing_on as the main breaker, but you also need to check what the current current_tracer (current tracer) is set to. If it's nop (i.e., No Operation), it means that even though the main breaker is on, no actual tracing probes have been installed, so the system is still running at native speed.
It's like turning on a light switch, but the bulb has no filament installed—no current flows, so no light is produced, and no electricity is consumed.
This is the benefit of CONFIG_DYNAMIC_FTRACE: only when you actually specify a tracer (like function_graph) does the kernel start modifying instructions and "installing the filament." Until then, everything remains static and zero-overhead.