9.10 Using trace-cmd, KernelShark, and perf-tools Frontends
Before diving in, a quick side note. When you spend a lot of time staring at ftrace reports, you might notice something—security-related interface calls occur at an astonishingly high frequency.
These calls are typically enforced through Linux Security Modules (LSMs), such as SELinux, AppArmor, Smack, TOMOYO, and others. If you are developing a highly performance-sensitive application (or project, such as a near-real-time system), these massive security checks can become a performance bottleneck. This might prompt you to disable these security interfaces (via kernel configuration—if feasible, at least on time-critical code paths). This overhead compounds especially when multiple LSMs are enabled simultaneously.
No Need to Reinvent the Wheel: We Need Frontends
There's no doubt that the Linux kernel's ftrace infrastructure is incredibly powerful. It acts like a precision microscope, letting you dive deep into the kernel and illuminating those normally invisible dark corners.
But this power comes at a price.
That price is a steep learning curve. You need to be intimately familiar with a plethora of tuning knobs and options under sysfs, and you must learn how to filter valuable signals from a sea of noise—as you experienced in the previous sections, this is no easy task.
To solve this problem, Steven Rostedt (the primary maintainer of ftrace) developed a powerful and elegant command-line frontend: trace-cmd. Going a step further, there is a true graphical frontend—KernelShark. It parses the binary trace files generated by trace-cmd (defaulting to trace.dat) and presents them in a GUI format that is much easier for humans to digest.
Similarly, Brendan Gregg developed a script-based ftrace frontend project—perf-tools.
The goal of this section is to free you from tedious manual configuration and show you how these tools make life better.
9.10.1 Introducing trace-cmd: Git-like Elegance
The design style of trace-cmd is very much like modern Linux console tools (such as Git). It features a large number of subcommands that allow you to easily record trace sessions—whether system-wide or targeted at a specific process (optionally including its child processes)—and generate reports.
It can do far more than just that:
- Control ftrace configuration parameters
- Clear and reset ftrace
- View current status
- List all available events, plugins, and options
- Even perform profiling, display histograms, generate snapshots, monitor network sockets, and more...
Since trace-cmd operates on the ftrace kernel subsystem under the hood, running its subcommands usually requires root privileges. We are using the version provided by Ubuntu 20.04 LTS here—2.8.3.
Getting Help
The documentation for trace-cmd is quite comprehensive. There are several ways to get help:
- Man pages: Every subcommand has its own man page. For example, to see the manual for the
recordsubcommand, typeman trace-cmd-record. Of course,man trace-cmdgives an overview of the tool and all its subcommands. - Quick help: Add
-hafter the command, for example,trace-cmd record -h. - Online tutorials: The "Further Reading" section at the end of this chapter lists some excellent tutorials.
Try typing this in your terminal and use bash's auto-completion to see what man pages are available:
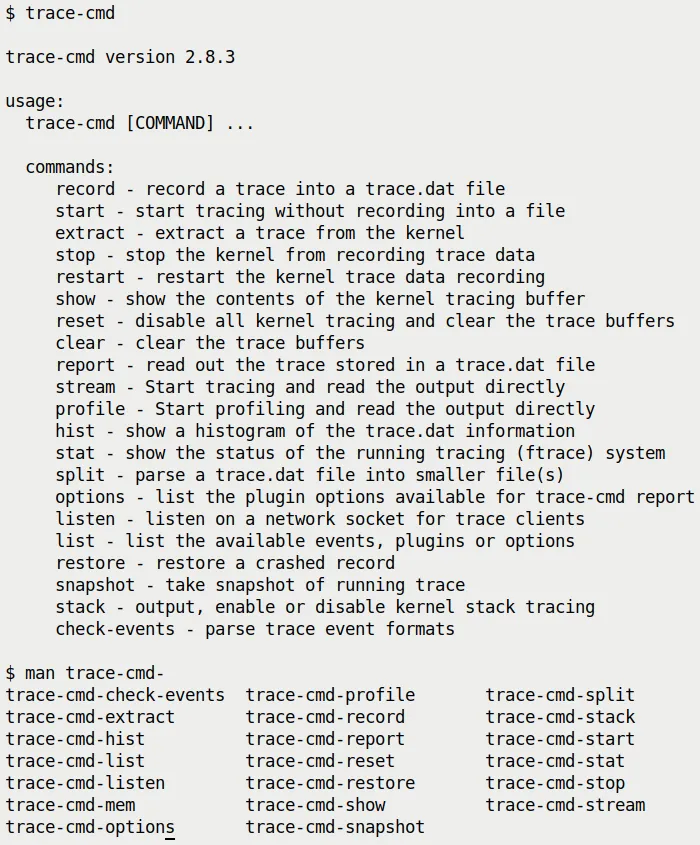 (Figure 9.20: trace-cmd brief help screen and available man pages)
First Hands-on: A Simple Trace Session
Let's jump right in and complete a very simple trace session. Due to space constraints, we won't repeat what is already explained in detail in the man pages—those deeper details are left for you to explore on your own. Let's get started:
Step 1: Reset the ftrace subsystem (optional)
sudo trace-cmd reset
This step is like wiping the table clean, ensuring that previous configurations don't interfere with this experiment.
Step 2: Record the trace
Let's use the famous function_graph plugin (tracer) to record everything happening in the kernel for 1 second. The -p option specifies the tracer. The -F <command> option tells trace-cmd to only trace that command (if you add -c, it will also trace its child processes):
sudo trace-cmd record -p function_graph -F sleep 1
Step 3: Generate the report
After tracing finishes, trace-cmd generates a binary file named trace.dat by default. To turn it into a human-readable ASCII text report, use the report subcommand.
The -l option is very useful; it adds the latency output format columns we mentioned in the "Digging into Latency Trace Information" section. In addition to the four latency columns we saw earlier, trace-cmd prefixes an extra column—the CPU core number—telling you which core the function ran on:
sudo trace-cmd report -l > sleep1.txt
Besides report, you can also use trace-cmd show to directly view the current ftrace buffer contents.
Also, in Step 2, instead of using -F to specify a command, you can use -P <PID> to specify a process ID.
Note: Step 2 generates a binary trace file defaulting to the name trace.dat (this is what we will feed to KernelShark later). Give these simple steps a try, and you'll find it's incredibly easier than manipulating raw ftrace directly!
Of course, on resource-constrained embedded systems, installing a frontend like trace-cmd might not be realistic (it really depends on your project/product). Therefore, mastering raw ftrace operations remains important—that's your ace in the hole.
⚠️ Gotcha Warning We recommend not running
trace-cmddirectly inside the tracefs (/sys/kernel/[debug]/tracing) directory.It might fail because it tries to write trace data into it (you'd need to use the
-ooption to force an override of the output path, etc., to resolve this). Don't sit in the directory and run it—step out first.
9.10.2 Ocean of Events: Taming Massive Data
The true power of trace-cmd has only just begun. trace-cmd list can list all available Events, as well as plugins and options.
The list is staggering—as of this writing (kernel 5.10 series), it has over 1,400 events! Give it a try:
$ sudo trace-cmd list
events:
  drm:drm_vblank_event
  drm:drm_vblank_event_queued
  drm:drm_vblank_event_delivered
  initcall:initcall_finish
  initcall:initcall_start
  initcall:initcall_level
  vsyscall:emulate_vsyscall
  xen:xen_cpu_set_ldt
[...]
tracers:
  hwlat blk mmiotrace function_graph wakeup_dl wakeup_rt wakeup function nop
options:
  print-parent
  nosym-offset
[...]
With so many events, it's dazzling. If you only want to see the event categories (Event Labels, similar to event classes) rather than every specific function, you can use a little bash magic to filter and sort:
$ sudo trace-cmd list -e | awk -F':' 'NF==2 {print $1}' | sort | uniq | tr '\n' ' '
alarmtimer asoc avc block bpf_test_run bpf_trace bridge cfg80211 cgroup clk
compaction cpuhp cros_ec devfreq devlink dma_fence drm error_report exceptions
ext4 fib fib6 filelock filemap fs_dax gpio gvt hda hda_controller hda_intel
huge_memory hwmon hyperv i2c i915 initcall intel_iommu intel_ish interconnect
iocost iomap iommu io_uring irq irq_matrix irq_vectors iwlwifi iwlwifi_data
iwlwifi_io iwlwifi_msg iwlwifi_ucode jbd2 kmem kvm kvmmmu libata mac80211
mac80211_msg mce mdio mei migrate mmap mmap_lock mmc module mptcp msr napi
neigh net netlink nmi nvme oom page_isolation pagemap pagepool percpu power
printk pwm qdisc random ras raw_syscalls rcu regmap regulator resctrl rpm rseq
rtc sched scsi signal skb smbus sock spi swiotlb sync_trace syscalls task tcp
thermal thermal_power_allocator timer tlb ucsi udp v4l2 vb2 vmscan vsyscall
wbt workqueue writeback x86_fpu xdp xen xhci-hcd $
Exactly which categories you see depends on the architecture, kernel version, and kernel configuration.
The best part comes next: You can pick one or more categories and use the -e option to make trace-cmd only record and report functions from those categories. For example:
trace-cmd record <...> -e net -e sock -e syscalls
You guessed it—this makes trace-cmd only record network, socket, and system call related trace events (functions) during the recording session.
Additionally, trace-cmd list can do a lot more. For example:
trace-cmd list -t: List all available tracers (completely equivalent tocat /sys/kernel/tracing/available_tracers).trace-cmd list -h: View the help menu for the list subcommand, which contains descriptions of all the switches.
If you want to trace specific functions (rather than all functions under an event category), use the -l option:
trace-cmd record [...] -l <func1> -l <func2> [...]
9.10.3 Practical Case 3.1: Tracing a Ping with trace-cmd
Remember how much effort we spent getting this done in "Case 2 — Tracing a Single Ping with Raw ftrace"? Now let's reproduce this experiment using trace-cmd—including displaying function arguments. It's very simple, requiring only two steps:
Step 1: Record the data
This time we use -q (quiet, to reduce output) and specify a series of relevant event categories (net, sock, skb, tcp, udp), using -F to specify the command and -c1 to send only one packet:
sudo trace-cmd record -q -e net -e sock -e skb -e tcp -e udp -F ping -c1 packtpub.com
Step 2: Generate the report
sudo trace-cmd report -l -q > reportfile.txt
Here's a small detail: if you added the -p function_graph parameter in the recording step, you would get a report with an indented call graph, but without function arguments (because the function_graph mechanism doesn't display arguments).
Both approaches have their uses, depending on whether you want to see the "flow structure" or the "specific values."
For convenience, I wrapped this single-ping trace into a simple bash script—ch9/tracecmd/trccmd_1ping.sh. When run, it lets you choose via options whether you want to see a function_graph style call graph or detailed information with arguments. Give it a try!
9.10.4 Modules Can't Escape: Kernel Modules and trace-cmd
Ftrace has a nifty trick: it can automatically identify all functions within any kernel module!
This is fantastic. As a frontend for ftrace, trace-cmd naturally inherits this capability. To verify this, I loaded a module I wrote earlier (ch5/kmembugs_test/test_kmembugs.ko). Then, we use trace-cmd list -f with grep to look for functions from this module.
Look, they actually show up:
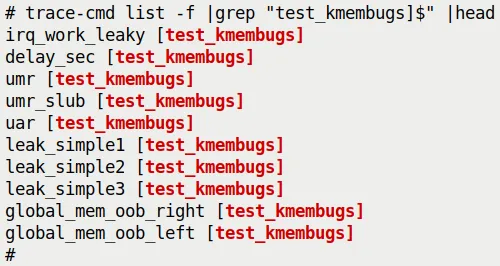 (Figure 9.21: trace-cmd automatically identifies and lists module functions available for tracing)
If you want to trace functions from a specific module exclusively, you can use it like this:
trace-cmd record [...] --module <module-name> [...]
9.10.5 KernelShark: Visualizing the Data
trace-cmd is great, but reading text reports can still be tiring. This is where KernelShark enters the picture. It is an excellent GUI frontend for trace-cmd output files.
More specifically, it parses the binary trace.dat files generated by trace-cmd record or trace-cmd extract.
What if You Only Have Raw ftrace Data?
You might ask: If I traced directly with raw ftrace and don't have a trace-cmd, can I still use KernelShark?
No problem. You just need to use trace-cmd extract to extract the raw trace buffer contents into a file—it will automatically convert it into the expected binary format! Follow this example (requires root privileges):
cd /sys/kernel/tracing
trace-cmd reset ; echo > trace
echo function_graph > current_tracer
echo 1 > tracing_on ; sleep .5 ; echo 0 > tracing_on
trace-cmd extract -o </path/to/>trc.dat
Now, trc.dat can be fed to KernelShark.
By the way, the latest version of KernelShark (2.1.0 as of March 2022) has migrated from GTK+ 2.0 to Qt 5. However, the combination of the latest trace-cmd (3.0.-dev) and KernelShark 2.1.0 can sometimes be unstable, so I am still using the older versions shipped with the Ubuntu 20.04 LTS distribution—trace-cmd 2.8.3 and KernelShark 0.9.8.
The official KernelShark documentation is very detailed and highly recommended: https://kernelshark.org/Documentation.html.
9.10.6 Practical Case 3.2: Viewing a Ping with KernelShark
Let's return to our favorite test—tracing a single ping! This time, we're going to look at it using KernelShark.
First, run our script to capture the data:
cd <booksrc>/ch9/tracecmd
./trccmd_1ping.sh -f
(We covered this script in Case 3.1; the -f option means recording with the function_graph tracer plugin).
Although the script generates a text report (ping_trccmd.txt), KernelShark doesn't consume that. It only eats the binary trace.dat file.
KernelShark is essentially a trace reader. It parses and displays the contents of trace.dat. If you run KernelShark in a directory containing a trace.dat file, it will load it automatically. You can also specify the file via the -i parameter, or open it through the File | Open menu in the GUI.
Here is what the KernelShark GUI looks like, visualizing our single ping:
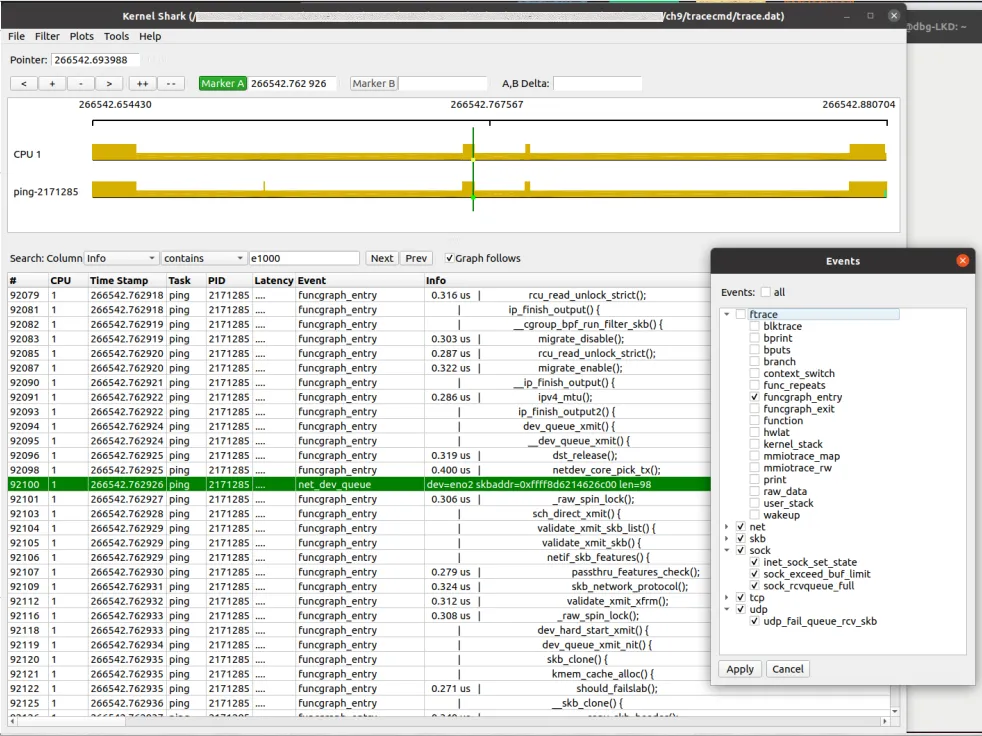 (Figure 9.22: KernelShark GUI visualizing a single ping; also showing the event filter dialog)
Pay attention to the filtering techniques here, they are very useful:
- CPU filter: Show only CPU 1 (or whichever core you care about). Accessed via
Plots | CPUs. - Tasks filter: Show only the
ping-[PID]task. Accessed viaPlots | Tasks. - Events filter: This is the core. We can set up a filter to exclude all ftrace events and keep only
funcgraph_entry. This way, we can clearly see the incoming kernel function names in the list view. Accessed viaFilter | Show events. (Tip: All kernel events can be found under/sys/kernel/tracing/events/).
Interpreting the KernelShark Interface
KernelShark mainly has two large tiled areas:
- Top: The Graph view. Displays the kernel stream graphically, with vertical tick marks representing events.
- Bottom: The List view. Essentially the raw ftrace/trace-cmd text output.
Above the graph area are the "cursor", navigation/zoom, and two marker controls. Between the two areas are the search and filter bars.
Here is a screenshot showing some key elements of the upper half of the GUI (this is from a different session):
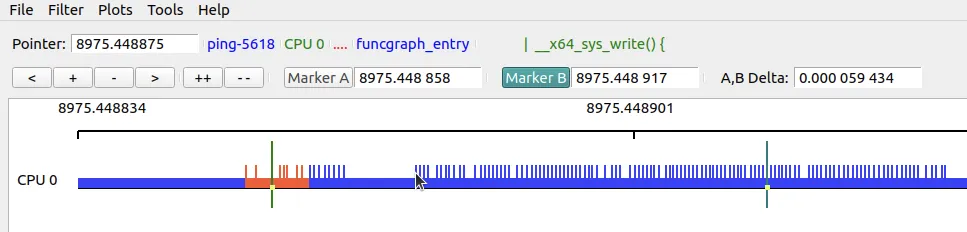 (Figure 9.23: Screenshot of the upper half of the KernelShark GUI)
Let's quickly go over the key points in Figure 9.23:
- Cursor: Shows the current position on the timeline. When you move your mouse over an event, that event's information (actually the content of the last column in the list view,
Info) is displayed to the right of the cursor. (In the figure, the mouse cursor points to the location on the graph where thepingprocess enters thewrite()system call, and detailed information is shown on the right). - Zoom and pan buttons:
<: Pan the graph left.+: Zoom in,-: Zoom out (mouse scroll wheel works too).>: Pan the graph right.++: Zoom in to the maximum.--: Zoom out to the full timeline width.
- Dual markers: This is a killer feature. It allows you to focus on a specific segment of the code path and see the time difference between two points. How to use: First click Marker B to activate it, then double-click anywhere on the graph or list to set it. Do the same to set Marker A. When both are set, the time difference is automatically displayed!
Green and Red Bars: Reading Scheduling Latency
When reading the KernelShark documentation, you'll find many gems. Here is a particularly useful one:
"The hollow green bars in front of some task bars represent the time from when a task was woken up to when it actually ran (wakeup latency). The hollow red bars between events indicate that although the task was in a runnable state, it was preempted by another task."
Since the hollow green bars represent wakeup latency, you can use the A and B markers to measure this time precisely.
Additionally, detailed custom filtering can be done through the Filters | TEP Advance Filtering menu (Advanced Filtering in older versions).
Like ftrace, KernelShark is also professionally used for debugging performance issues and root cause analysis. Here is an article by Steven Rostedt: Using KernelShark to analyze the real-time scheduler (Feb 2011).
However, KernelShark is evolving from being the "only GUI" to being one of many frontends, all based on a library framework that provides underlying access to raw trace data (as hinted at in Figure 9.2 of this chapter).
9.10.7 perf-tools: The Power of Bash Scripts
Now let's look at another set of tools. The perf-tools project is a (mostly) collection of Bash scripts that essentially wrap the kernel's ftrace and perf_events (perf) infrastructure.
They help automate a massive amount of work in performance analysis/observability/debugging at the kernel (and some user-space) level. The primary author is Brendan Gregg.
Project URL: https://github.com/brendangregg/perf-tools
This is not unfamiliar to us. In Chapter 4, Debug via Instrumentation – Kprobes, we covered the kprobe[-perf] tool from this collection in depth.
After installing the perf-tools[-unstable] package, the scripts are typically installed in /usr/sbin. Let's see what's available:
$ (cd /usr/sbin; ls *-perf)
bitesize-perf   execsnoop-perf   funcgraph-perf
functrace-perf  iosnoop-perf     kprobe-perf
perf-stat-hist-perf
syscount-perf   tpoint-perf      cachestat-perf
funccount-perf  funcslower-perf  iolatency-perf
killsnoop-perf  opensnoop-perf   reset-ftrace-perf
tcpretrans-perf uprobe-perf
$
These tools cover various parts of the Linux stack. A picture is worth a thousand words; here is an amazing diagram from the perf-tools GitHub repository:
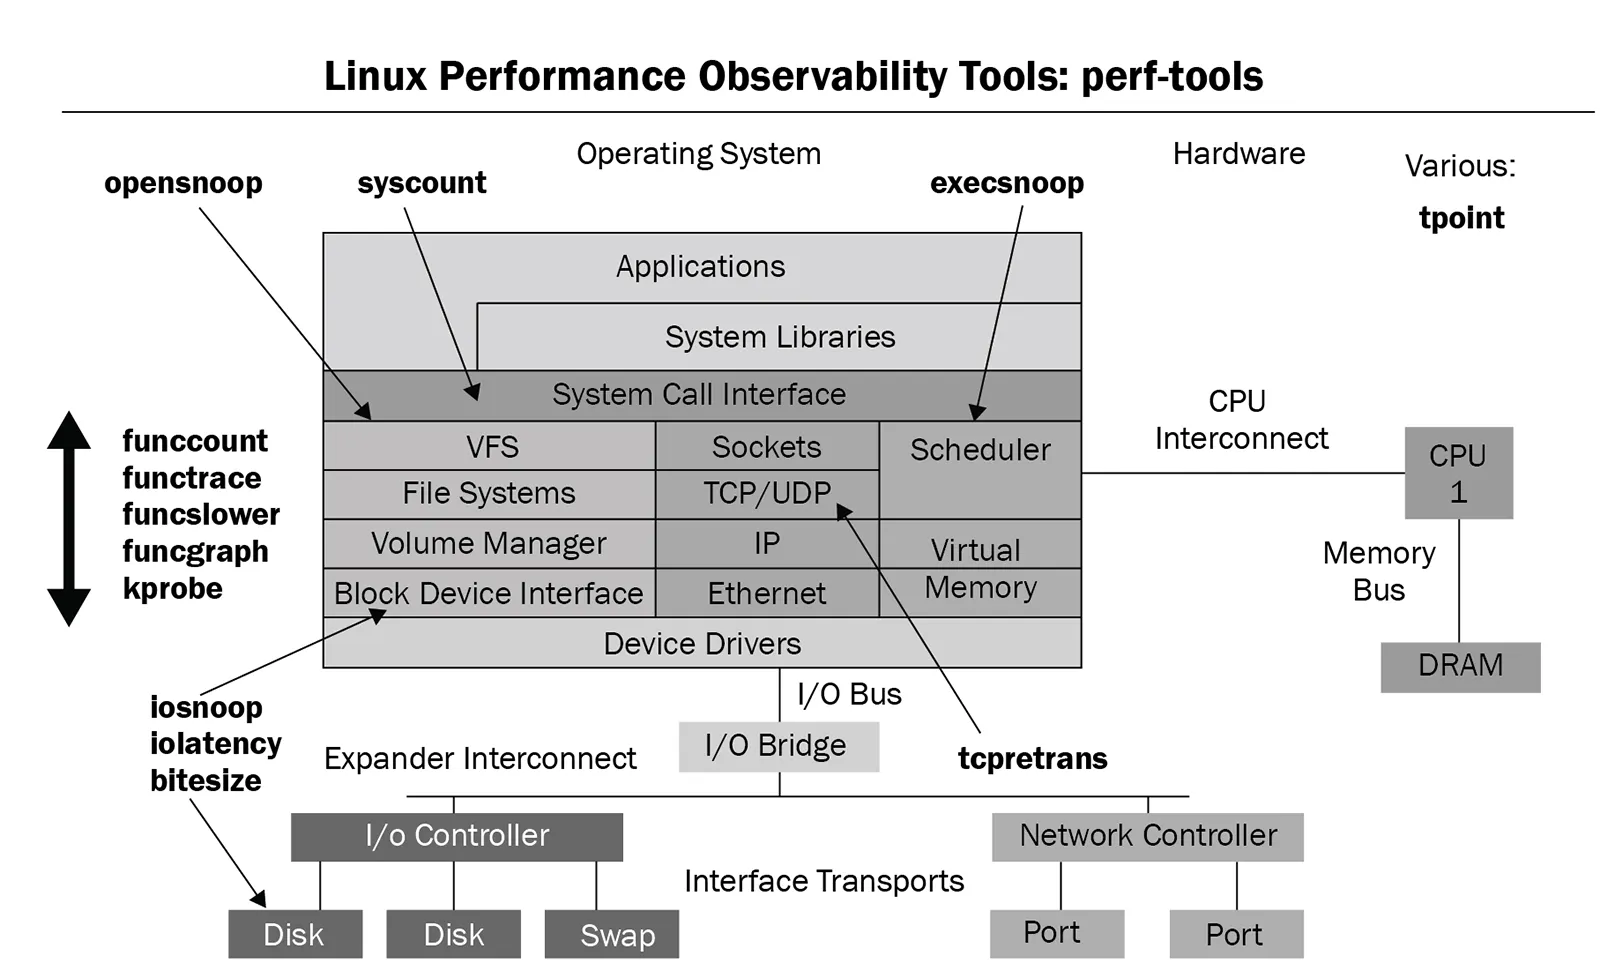 (Figure 9.24: perf-tools script collection diagram, source: perf-tools GitHub repository)
A quick glance at this diagram, and you'll know where these tools can be applied.
Another advantage of this toolset is its excellent documentation. Each tool has its own man page, and adding -h on the command line usually gives a very concise summary and a one-line example usage (just like the upper half of Figure 9.25).
Due to space constraints, we'll only pick a few of the most representative examples (kprobe[-perf] was covered in Chapter 4).
9.10.8 Practical: Tracing All open() Calls
Remember in Chapter 4, when we went to great lengths to figure out exactly which files were being opened (via the open() system call, corresponding to do_sys_open() in the kernel)?
Now let's revisit this problem the ftrace way, and in a much simpler way—using the perf-tools wrapper script opensnoop[-perf]!
It's an absolute piece of cake. Needless to say, you must run it as root:
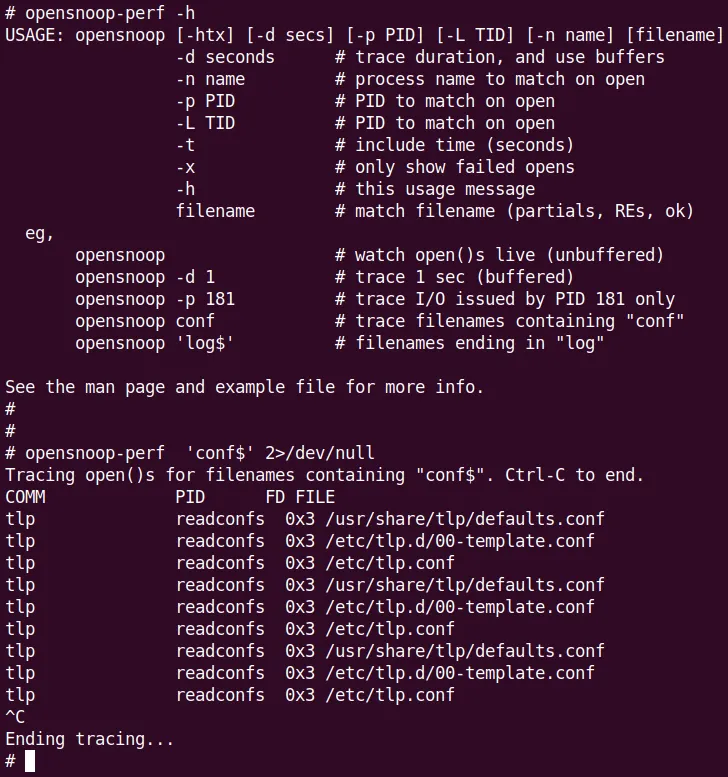 (Figure 9.25: opensnoop[-perf] help screen—it actually comes with examples! And a quick example tracing all file open operations ending in conf system-wide)
💡 Digging Deeper: Read the Code I highly recommend reading the source code of these perf-tools scripts.
funcgraph[-perf]is a great example: https://github.com/brendangregg/perf-tools/blob/master/kernel/funcgraph It's essentially a Bash script wrapper around the exact raw ftrace function_graph tracer usage we learned earlier in this chapter.
Also, recall the section Observability with eBPF tools in Chapter 4, where we did something similar using the BCC frontend opensnoop-bpfcc.
9.10.9 Practical: Finding "Slow" Functions
Let's look at another perf-tools example—using funcslower[-perf] to find functions with anomalous latency!
That is, functions that are running too slowly.
For example, I checked the mutex_lock() kernel function on my x86_64 laptop to see if any took longer than 50 microseconds:
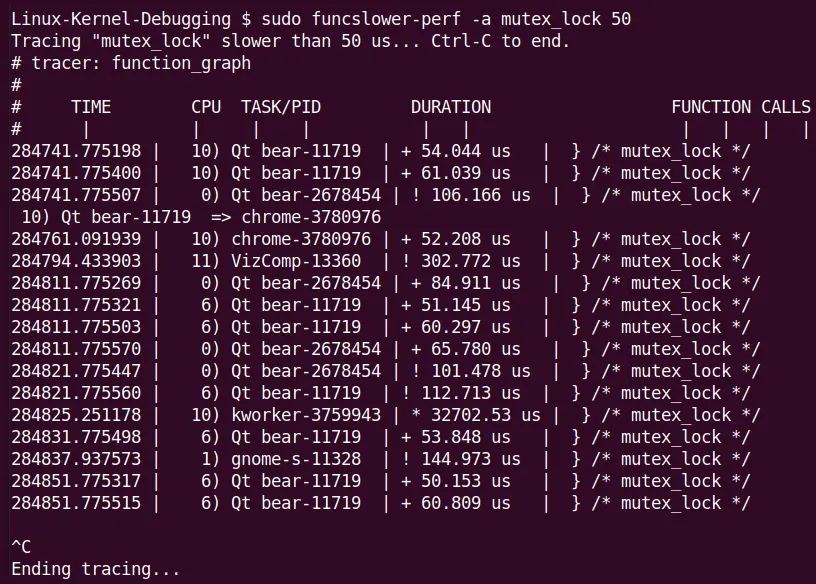 (Figure 9.26: Screenshot of funcslower[-perf] catching an outlier)
Notice the massive outlier in the figure—a kworker thread took over 32 milliseconds to acquire a lock! This is definitely a rare edge case.
This once again shows that standard Linux is absolutely not a Real-Time Operating System (RTOS). Of course, Linux can actually be run as an RTOS—look up the Real-Time Linux (RTL) wiki and patches to find out more.
More examples of funcslower can be found here: https://github.com/brendangregg/perf-tools/blob/master/examples/funcslower_example.txt.
9.10.10 Don't Forget eBPF
Finally, it must be mentioned: the functionality of many perf-tools scripts has now been surpassed by the newer, more powerful eBPF technology.
Brendan Gregg's answer to this is his updated eBPF frontends—the *-bpfcc toolset! (See https://www.brendangregg.com/ebpf.html for details).
Recall the example in Chapter 4, when we tried to find out who was sending execve() system calls, the perf-tools from execsnoop-perf fell short, while the execsnoop-bpfcc BCC frontend script handled it perfectly.
9.10.11 Netflix's Cloud Practice: A Teaser
This "relentless pursuit" spirit is not limited to the mobile world.
In the cloud, Ftrace is also a pillar of stability. Here is a teaser for an even more exciting real-world case: using perf-tools scripts (the Ftrace-based frontend toolkit written by Brendan Gregg that we mentioned earlier) to debug a database disk I/O issue on Netflix Linux instances.
We will have a dedicated section later ("Investigating a database disk I/O issue on Netflix cloud instances with perf-tools") to cover this.
The battlefield there shifts from mobile phones to cloud servers, and the weapon of choice shifts from raw Ftrace to friendlier scripts, but the core logic remains the same: see the invisible.
9.10.12 Supplement: The Author's trccmd Utility
By the way, I also wrote a wrapper script called trccmd on top of trace-cmd. If you're interested, you can check it out at this GitHub repository: https://github.com/kaiwan/trccmd.
For example, using this tool to trace the flow of a single ping packet:
./trccmd -F 'ping -c1 packtpub.com' -e 'net sock skb tcp udp'
Now that we've covered the hard training of raw Ftrace and experienced the ease of trace-cmd and KernelShark, it's time to see how to apply these tools to Netflix-level cloud environment practices.