9.4 Tracing Kernel Flow with ftrace
In the previous section, we mentioned that although tracing_on is 1, as long as current_tracer remains nop, the system incurs zero overhead. It's like a light socket that has power but no bulb installed.
So what happens when we screw in the "bulb"—the actual tracer?
That's the focus of this section. You'll find that the pseudo-files under the /sys/kernel/tracing directory are essentially a row of control knobs. We previously only looked at the tracing_on master switch; now it's time to get serious.
9.4.1 Choosing the Right Probe: Tracer
You can think of ftrace as a multimeter with many different settings. In ftrace terminology, these settings are called Tracers, sometimes referred to as plugins. Different tracers determine exactly "what the kernel is recording."
Not all tracers are compiled into the kernel by default. To see which settings are available on your system, read the available_tracers file:
# cat available_tracers
hwlat blk function_graph wakeup_dl wakeup_rt wakeup function nop
This lists the tracers available under your current kernel configuration.
Revisiting the Analogy
In the previous section, we compared tracing_on to a "master switch." Following that analogy, current_tracer is about choosing the "bulb model" to install in the socket.
nop: This means "no bulb installed." The socket is there, the switch works, but nothing happens.function: A basic model. It records every function executed by the kernel.function_graph: An enhanced model. It not only records functions but also uses indentation to draw the call relationships, looking like an inverted tree.
While function is decent, we strongly recommend function_graph. Why? Because it lets you see the logical flow of the code, not just a long list of functions. Looking at a call graph is as intuitive as looking at code structure—this is key to understanding kernel execution flow.
Now, let's check what "bulb" is currently installed:
# cat current_tracer
nop
The default is indeed nop.
9.4.2 First Hands-On: Capturing One Second of Kernel Activity
Enough theory, let's get our hands dirty.
Our goal is simple: enable ftrace, let it record 1 second of kernel activity, and then stop.
But before we start, we must remind you of a critical operational detail: once you change current_tracer to a valid tracer (like function_graph), tracing begins immediately (as long as tracing_on is 1). The kernel won't wait for you—it's very obedient and impatient.
So, to be safe, our operation sequence is:
- Turn off the master switch first (
echo 0 > tracing_on). - Swap the tracer (
echo function_graph > current_tracer). - Flip the switch on, sleep for a second, and flip it off.
Let's do it:
# echo 0 > tracing_on
# echo function_graph > current_tracer
# echo 1 > tracing_on ; sleep 1; echo 0 > tracing_on
#
That's it. Where's the data? In the trace pseudo-file.
# ls -l trace
-rw-r--r-- 1 root root 0 Jan 19 17:25 trace
Notice that the file size is 0. Don't panic—this doesn't mean there's no data.
This is a classic pseudo-file trap. The size of the trace file is intentionally displayed as 0 to tell you "this isn't a regular disk file." This is a callback-based technology—the kernel only dynamically generates data when you read it.
So, you need to copy it to a real file:
# cp trace /tmp/trc.txt
# ls -lh /tmp/trc.txt
-rw-r--r-- 1 root root 4.8M Jan 19 19:39 /tmp/trc.txt
See that? In just 1 second, we captured 4.8MB of data. I used wc to count the lines—about 98,376 in total.
What does this tell us?
It tells us the kernel was extremely busy during that second. And don't forget, this is all kernel activity across all CPU cores—including system calls, interrupts, and low-level context switches. It's like tuning a fire department's radio to monitor mode; you hear all channels talking at once.
A massive data volume brings its own problems: too much noise. We'll cover how to filter this later, but for now, let's see what this data actually looks like.
Let's grab a random snippet (I used head to get the first 40 lines):
# head -n40 /tmp/trc.txt
# tracer: function_graph
#
# CPU  DURATION                 FUNCTION CALLS
# |     |   |                    |   |   |   |
[...]
5)   1.156 us    |  tcp_update_skb_after_send();
5)   1.034 us    |  tcp_rate_skb_sent();
5)               |  tcp_event_new_data_sent() {
5)   1.107 us    |    tcp_rbtree_insert();
5)               |    tcp_rearm_rto() {
5)               |      sk_reset_timer() {
5)               |        mod_timer() {
5)               |          lock_timer_base() {
5)               |            _raw_spin_lock_irqsave() {
5)   0.855 us    |              preempt_count_add();
5)   2.754 us    |            }
5)   4.88 us    |          }
[...]
The information here is quite intuitive:
- The leftmost
5): This happened on CPU 5. - The middle numbers (like
1.156 us): Function execution time. - The function names on the right: The actual code executed.
- Indentation: Notice how
tcp_event_new_data_sentcalledtcp_rearm_rto, which in turn calledsk_reset_timer? This indentation is the core value offunction_graph—it shows you the call stack.
9.4.3 Seeing Through the Context: Who is Actually Running This Code?
The output above is detailed, but it's missing a crucial piece of information.
We can see network functions starting with tcp_ running, but who is running them? Was it triggered by a user-space web server process? Is it a kernel background thread running on its own? Or was it triggered by a network card interrupt?
This isn't just idle curiosity. The processing logic for Process Context and Interrupt Context is fundamentally different. If you mistakenly assume a piece of code is running in process context and put it to sleep, when it's actually in interrupt context, the system could crash outright.
Returning to the "radio monitoring" analogy:
- With only
function_graph, you only hear "A calling B." - With context information added, you can tell whether "a patrol car is calling headquarters" or "headquarters is calling a patrol car."
As a monolithic kernel, Linux code runs in only two contexts:
- Process Context: A process issued a system call, and the kernel is doing work on its behalf.
- Interrupt Context: Hardware or a softirq interrupted a process to handle an emergency event.
ftrace can tell you the answer, but you need to manually enable an option. All the control knobs are in the options directory.
9.4.4 Resetting and Configuring Options: funcgraph-proc
Before we keep playing with knobs, let's build a good habit: Resetting.
After experimenting with a bunch of configurations, ftrace's state might get a bit messy. Instead of trying to remember what you changed, it's better to restore it to defaults with a single command.
In Chapter 1, we installed a tool called perf-tools (not exactly perf, but Brendan Gregg's script collection), which includes a script called reset-ftrace:
# reset-ftrace
Reseting ftrace state...
current_tracer, before:
     1    nop
current_tracer, after:
     1    nop
[...]
It writes a bunch of key files back to their default values. But note that it might not cover all options. If you want to be thorough, you can use trace-cmd (we'll dive into this tool later):
# trace-cmd reset
This turns off all tracing, clears the buffer, and returns the kernel to "factory settings."
Now, let's enable "show process info" mode.
The file controlling this feature is options/funcgraph-proc. The proc stands for process.
# echo 1 > options/funcgraph-proc
Let's run the 1-second trace again and compare the results (this time we capture immediately after enabling tracing_on, because tracing only starts once the option is set):
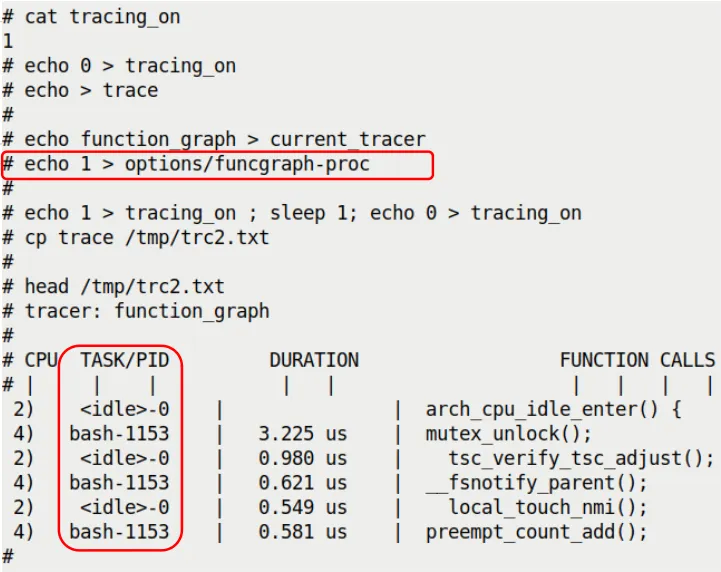 (Note: This is a figure referenced from the original text, showing the effect of enabling funcgraph-proc)
See the difference? In the CPU column and the TASK/PID column, we now have specific process information alongside the CPU number.
<idle>-0: This is the idle process (PID 0) on CPU 2. It's slacking off.bash-1153: This is the bash process (PID 1153) on CPU 4. It's doing work.
Even more interestingly, you can intuitively see parallelism: at the same moment, CPU 2 is running the idle process's hook functions, while CPU 4 is handling a bash system call. These two cores don't interfere with each other and are busy with their own tasks.
9.4.5 Going Deeper: Latency-format and Interrupt Context
Even with funcgraph-proc enabled, there's still a trap.
Seeing functions running under <idle>-0, do you assume it's just the idle process running on its own? Not necessarily. It's entirely possible that a hardware interrupt interrupted the idle process and forcibly executed an interrupt handler on the CPU. But in the TASK/PID column, it will still show the interrupted task (which is <idle>-0).
It's like you're sleeping at home (<idle>), and suddenly a postman (interrupt) rushes in, shakes you awake, shoves a letter in your hand, and runs off. The log might just say "you were home," without mentioning the postman at all.
To see the true face of interrupts, we need to enable another powerful tool: latency-format.
This option forces ftrace to add a column of highly detailed context descriptors to the output. It's located at options/latency-format.
# echo 1 > options/latency-format
Now, our report will have an extra column that looks like gibberish, such as d.h2. Don't worry—it's not gibberish; it's a cipher for the kernel's state.
Let's run it once and grab a snippet of the report:
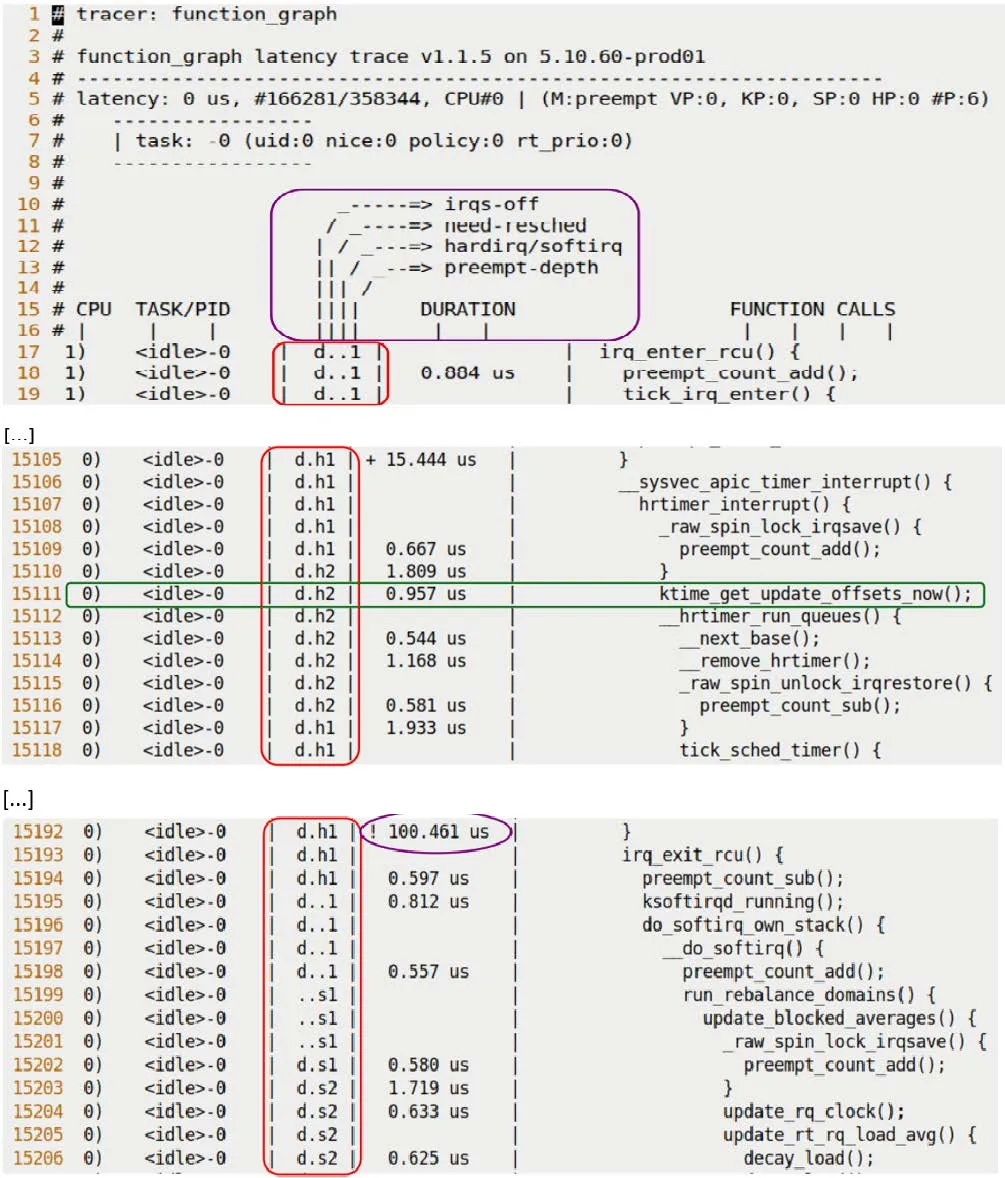 (Note: This is a figure referenced from the original text, showing the latency-format output)
Pay attention to that middle column, d.h2. Here's how to decode it:
9.4.6 Cracking the Code: What Does d.h2 Mean?
This column (Latency Info) consists of 4 characters, each representing a dimension. Let's break down the example from the original text, d.h2:
Position 1: Hardware Interrupt State
d: Disabled. Interrupts are off..: Enabled. Interrupts are on.
Position 2: Rescheduling Needed
N: Highest priority, rescheduling needed.n: Normal priority, rescheduling needed.p: Preemptive rescheduling flag..: All clear, no rescheduling needed.
Position 3: Current Execution Context (Key!)
Z: An NMI (Non-Maskable Interrupt) occurred, and it interrupted a hardirq.z: An NMI is running.H: A hardirq occurred, and it interrupted a softirq.h: A hardirq is running.s: A softirq is running..: Normal process context.
Position 4: Preempt Depth
- A number: Represents the preempt count value.
- If greater than 0, it means the kernel is currently in a non-preemptible critical section (e.g., holding a spinlock).
Back to our example, d.h2:
d: Hardware interrupts are disabled..: No rescheduling needed.h: The code is running in hard interrupt context.2: Preempt depth is 2 (meaning this interrupt handler likely acquired a spinlock or nested two levels of locks, during which it cannot be preempted).
Combined with the earlier context, this makes perfect sense: the <idle>-0 process on CPU 0 was sleeping when it was interrupted by a hardware interrupt (h). The interrupt handler disabled interrupts (d), acquired a lock (2), and then executed ktime_get_update_offsets_now().
That's the truth.
If you see .... in a line, that's pure process context—all is peaceful.
9.4.7 Latency Markers: Who's Slacking?
Besides the state cipher, ftrace has another thoughtful feature: visual latency markers.
When a function's execution time is too long, ftrace prepends a symbol before the duration to alert you that "this is slow."
Look at this line:
0) <idle>-0 | d.h1 | ! 100.461 us | }
Notice the ! before the time? That's a latency marker.
The rules are as follows:
$: Exceeds 1 second (practically a disaster).*: Exceeds 100 milliseconds (very slow).!: Exceeds 10 microseconds (note: while microseconds are small, this counts as slow in the kernel).+: Exceeds 1 microsecond.- Space (no marker): Less than 1 microsecond (normal).
In function_graph mode, this feature is enabled by default and controlled by options/funcgraph-overhead. If you find it too distracting, you can turn it off:
# echo 0 > options/funcgraph-overhead
9.4.8 Other Useful Knobs
ftrace has so many knobs it can make your head spin. Here are a few particularly practical ones.
1. Checking Buffer Size: buffer_size_kb
If there's too much log data, the buffer will overflow. You can view or set the buffer size per CPU (in KB).
# cat buffer_size_kb
4096
If you're running a high-stress test and feel 4MB isn't enough, you can write a number into it:
# echo 8192 > buffer_size_kb
2. trace_options: The Grab Bag
There's also a file called trace_options, which is a massive collection of various toggles.
# cat trace_options
print-parent
nosym-offset
nosym-addr
verbose
[...]
Here's something interesting: sym-offset.
Remember the RIP information we saw when analyzing Oops? Like do_the_work+0x124/0x15e? This offset format is extremely helpful for pinpointing issues.
You can add this format to ftrace's output:
# echo sym-offset > trace_options
Afterward, function names might be followed by offsets, helping you pinpoint exactly which line of a function made the call.
3. Real-Time Monitoring: trace_pipe
If you don't want to wait until the end to copy a file, and instead want to watch logs flow across the screen like water, use trace_pipe.
# cat trace_pipe
It's a pipe file that reads as a stream. It's great for pairing with grep to search while it's running:
# cat trace_pipe | grep "netif_receive"
9.4.9 Chapter Summary: The Lens for Mastering the Black Box
In this section, we did one thing: turned ftrace from a "flashlight with only an on/off switch" into a "high-definition camera with night vision."
By combining function_graph, latency-format, and funcgraph-proc, we can now not only see what functions the kernel ran, but also clearly identify which CPU it was on, which process it belonged to, whether it was interrupted, and even whether interrupts were disabled and locks were held.
It's like giving the kernel an MRI.
Remember the d.h2 cipher? If we give you a line of log now, you should be able to tell at a glance whether the kernel was shivering (interrupt storm) or breathing normally.
In the next section, we'll automate this manual process using more advanced tools (trace-cmd and KernelShark). After all, nobody wants to type twenty lines of commands every time they need to capture a trace.