4.3 Using Static kprobes — Demo 3 & Demo 4
In the previous section, we figured out how parameters are quietly passed deep within the kernel by manually inspecting processor registers. It's like learning the grammar of a dialect — now you can finally understand what they're saying.
If we just stare at functions, we're merely spectators; true debugging masters take the stage — not only do they see a function being called, but they also capture the parameters it passes.
In the next two demos (Demo 3 and Demo 4), we'll continue using the traditional static kprobe approach (remember, "static" means any modification requires recompiling the module). We're going to do something highly practical: intercept the parameters of the probed function. This is often a lifesaver in real-world troubleshooting — many times, the root cause of a bug is simply a wrong parameter or a corrupted pointer being passed in.
Demo 3 will walk you through extracting these parameters from registers step by step; Demo 4 will take it a step further — we'll write a semi-automated script to generate this code.
Demo 3 — Static kprobe: Intercepting the File Open System Call and Retrieving the Filename Parameter
You've probably noticed that Demo 2 is quite a bit smarter than Demo 1 — it allows you to pass in any function name you want to probe via a module parameter. But is that enough? Not even close. In real debugging scenarios, you don't just need to know that do_sys_open was called; you absolutely need to know which file it's trying to open. This is often what separates "I can fix this bug" from "I have no idea what's going on."
💡 Tip: Many bugs are caused by incorrect parameter passing (usually an invalid or corrupted pointer). Be extra careful — double-check your assumptions and don't trust your intuition too much.
Following our demo storyline, the probed function do_sys_open looks like this:
long do_sys_open(int dfd, const char __user *filename, int flags, umode_t mode);
If we could grab its parameters in the pre-handler, especially the second parameter filename, our debugging efficiency would skyrocket. All that ABI groundwork from the previous section was building up to this moment.
The Forgotten Jprobes
Before we dive in, let's mention a historical kernel interface called Jumper probes (jprobes). It was originally designed specifically for stealing function parameters — it let you jump directly into the function to access them. Sounds perfect, right?
But it was ruthlessly deprecated in kernel version 4.15. The official reasoning was: since there are simpler methods (leveraging the kernel's tracing infrastructure), why maintain this complex interface?
If you're unfortunate enough to maintain a legacy kernel from before 4.15, jprobes are indeed a helpful tool. But for us, we need to learn the "manual transmission" approach — using our ABI knowledge to pull data directly from pt_regs. As for the simpler methods (like dynamic kprobes), we'll cover those in later chapters.
Alright, let's turn this ABI knowledge into code.
Retrieving the Filename Parameter
Let's look at the core code snippet for Demo 3 (find the complete code on GitHub). We'll jump straight to the meat of the matter: the pre-handler.
// ch4/kprobes/3_kprobe/3_kprobe.c
static int handler_pre(struct kprobe *p, struct pt_regs *regs)
{
    char *param_fname_reg;
Notice the two parameters of the pre-handler:
- A pointer to the
kprobestructure. - A pointer to the
pt_regsstructure — this is our treasure chest.
The struct pt_regs structure wraps the CPU's register state and is obviously architecture-dependent. Its definition lives in architecture-specific header files.
Suppose you're running this module on an ARM-32 (AArch32) system (like a Raspberry Pi Zero W or BeagleBone Black). The ARM-32 pt_regs is defined in arch/arm/include/asm/ptrace.h. The CPU registers are stored in an array called uregs. The header file provides a macro:
#define ARM_r1 uregs[1]
Recall the ABI table from the previous section: ARM-32 passes its first four arguments through registers r0, r1, r2, r3. The second parameter, filename, sits right in r1. So, our code extracts it like this:
#ifdef CONFIG_ARM
/* ARM-32 ABI:
 * 前四个参数通过以下通用寄存器传递: r0, r1, r2, r3
 * 参考 kernel 的 pt_regs 结构体 - 这里是 CPU 寄存器的副本:
 * https://elixir.bootlin.com/linux/v5.10.60/source/arch/arm/include/asm/ptrace.h#L135
 */
param_fname_reg = (char __user *)regs->ARM_r1;
#endif
Applying the same logic for x86 and AArch64, we use conditional compilation to grab the second parameter from the corresponding register into the param_fname_reg variable:
#ifdef CONFIG_X86
    param_fname_reg = (char __user *)regs->si;
#endif
[...]
#ifdef CONFIG_ARM64
/* AArch64 ABI:
 * 前八个参数(以及返回值)通过以下通用寄存器传递: x0 到 x7 (64-bit GPRs)
 * 参考 kernel 的 pt_regs 结构体:
 * https://elixir.bootlin.com/linux/v5.10.60/source/arch/arm64/include/asm/ptrace.h#L173
 */
    param_fname_reg = (char __user *)regs->regs[1];
#endif
As shown in the previous section's table: on x86_64, the second parameter is in the [R]SI register; on ARM64, it's in the X1 register. The code perfectly aligns with the ABI rules.
Now that we have the parameter pointer, can we just directly printk and print it?
Not so fast — there's a trap here.
This is where kernel programming gets tricky: you cannot directly dereference the param_fname_reg pointer. Why? Because it points to user-space memory, while our code is running in kernel space. Blindly accessing a user-space pointer can cause anything from an error to a full kernel panic.
We must use the strncpy_from_user() kernel API to safely copy it into a kernel-space buffer we pre-allocated (fname) (this memory was allocated using kzalloc() during init):
if (!strncpy_from_user(fname, param_fname_reg, PATH_MAX))
    return -EFAULT;
pr_info("FILE being opened: reg:0x%px   fname:%s\n",
        (void *)param_fname_reg, fname);
Incidentally, there's an interesting side effect: the strncpy_from_user() call will only throw a warning if we run this module on a kernel with debugging options enabled:
BUG: sleeping function called from invalid context at lib/strncpy_from_user.c:117
The culprit is the might_fault() function on the lib/strncpy_from_user.c:117 line. Simply put, it detects that the kernel has CONFIG_PROVE_LOCKING or CONFIG_DEBUG_ATOMIC_SLEEP enabled, and calls might_sleep().
The comment for this function spells it out clearly:
/**
- might_sleep - annotation for functions that can sleep
- this macro will print a stack trace if it is executed in an atomic context (spinlock, irq-handler, ...).
- ... */
We're using a debug kernel, and both of these options happen to be enabled, so you'll see this warning. It's like someone loudly whispering in your ear, "Hey, this might sleep." In this scenario, there's not much we can do about it for now — we just have to live with it and note it as a TODO.
Aside from this minor hiccup, the rest of the code is basically the same as Demo 2. Let's run it.
To keep the log volume manageable, we still only print when the process context is vi. Figure 4.5 shows the tail end of the dmesg output:
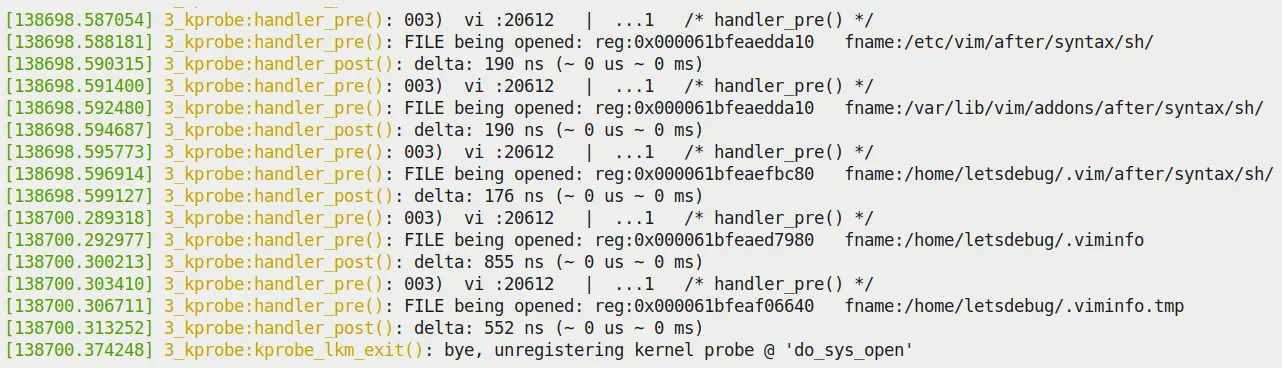
Figure 4.5 – Tail of dmesg output from the 3_kprobe demo on an x86_64 VM (filtered to show only the vi process context)
Look at that — the second parameter of do_sys_open, the full path of the file being opened, is clearly displayed right there!
A Change of Flavor: Trying It on a Raspberry Pi 4 (AArch64)
To prove this isn't limited to x86, I also threw this module onto a Raspberry Pi 4 (running 64-bit Ubuntu, full AArch64 architecture). Compiling and inserting the module:
rpi4 # sudo dmesg –C; insmod ./3_kprobe.ko kprobe_func=do_sys_open ; sleep 1 ; dmesg|tail -n5
[ 3893.514219] 3_kprobe:kprobe_lkm_init(): FYI, skip_if_not_vi is on, verbose=0
[ 3893.525200] 3_kprobe:kprobe_lkm_init(): registering kernel probe @ 'do_sys_open'
From the output, the new module parameter skip_if_not_vi is on by default (value of 1), meaning only file opens by vi will be captured.
Let's run an experiment: dynamically modifying this parameter at runtime.
First, don't forget to turn on all the debug print switches:
rpi4 # echo -n "module 3_kprobe +p" > /sys/kernel/debug/dynamic_debug/control
rpi4 # grep 3_kprobe /sys/kernel/debug/dynamic_debug/control
<...>/3_kprobe.c:98 [3_kprobe]handler_pre =p "%03d) %c%s%c:%d   |  %c%c%c%u   /* %s() */\012"
<...>/3_kprobe.c:158 [3_kprobe]handler_post =p "%03d) %c%s%c:%d   |  %c%c%c%u   /* %s() */\012"
Now query and change the skip_if_not_vi parameter to 0:
rpi4 # cat /sys/module/3_kprobe/parameters/skip_if_not_vi
1
rpi4 # echo –n 0 > /sys/module/3_kprobe/parameters/skip_if_not_vi
Now all file open system calls will be captured. Figure 4.6 shows the result (you can clearly see the dmesg and systemd-journal processes opening various files):
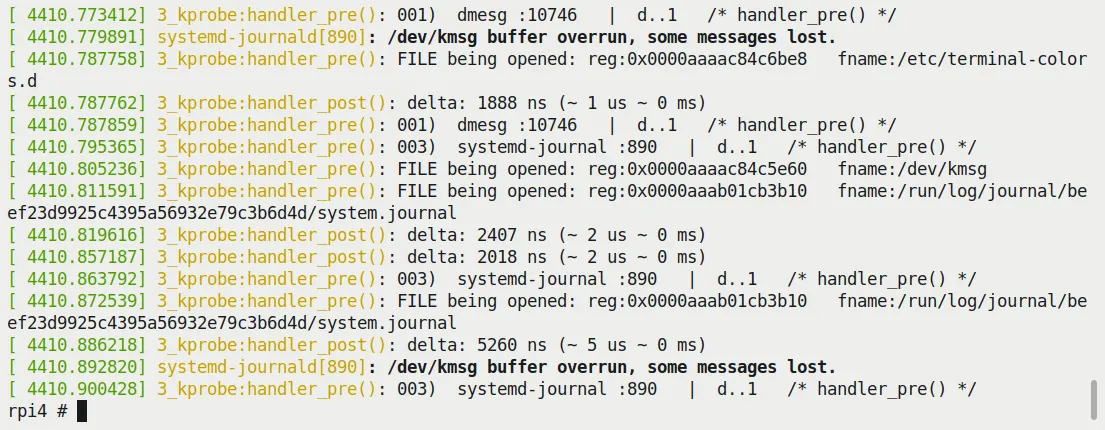
Figure 4.6 – Screenshot of running 3_kprobe on a Raspberry Pi 4 (AArch64), showing all files being opened
It runs perfectly! This is thanks to correctly handling the AArch64 architecture logic in our code (remember those #ifdef CONFIG_ARM64 ... blocks?).
You definitely need to try this trick yourself — that god's-eye view of file opens is really satisfying.
Demo 4 — Semi-automated Static kprobes via a Helper Script
Writing code manually is satisfying, but having to modify C code, compile, and insert the module every time does get tedious. Can we automate it a bit?
Of course. This time we use a Shell (bash) script (kp_load.sh) to do the heavy lifting. You just tell it which function you want to probe and which module it's in (optional), and it handles all the dirty work — generating the C code template, generating the Makefile, compiling, and inserting it into the kernel.
Due to space constraints, I won't show all the code for the script and kernel module (helper_kp.c), but I'll focus on how to use it. Of course, I highly recommend reading the source code (ch4/kprobes/4_kprobe_helper).
Before running, the script performs some health checks, such as confirming the kernel actually supports kprobes. Running it without arguments displays the help information:
$ cd ch4/kprobes/4_kprobe_helper
$ sudo ./kp_load.sh
[sudo] password for letsdebug: xxxxxxxxxxxx
[+] Performing basic sanity checks for kprobes support...  OK
kp_load.sh: minimally, a function to be kprobe'd has to be specified (via the --probe=func option)
Usage: kp_load.sh [--verbose] [--help] [--mod=module-pathname] --probe=function-to-probe
       --probe=probe-this-function  : if module-pathname is not passed, then we assume the function to be kprobed is in the kernel itself.
       [--mod=module-pathname]       : pathname of kernel module that has the function-to-probe
       [--verbose]                   : run in verbose mode; shows PRINT_CTX() o/p, etc
       [--showstack]                 : display kernel-mode stack, see how we got here!
       [--help]                      : show this help screen
$
Let's do something exciting — probe the network card driver's hardware interrupt handler.
The following steps are based on this scenario: the platform is Ubuntu 20.04 LTS, running a custom production kernel (5.10.60-prod01), on an x86_64 virtual machine.
Step 1: Identify the Network Card Driver
On my system, the network card is enp0s8. Use the ethtool tool to check its details:
# ethtool -i enp0s8 |grep -w driver
driver: e1000
The -i parameter specifies the network interface. Then use lsmod to confirm the e1000 driver is actually in memory (and loaded as a module):
# lsmod |grep -w e1000
e1000                 135168  0
Step 2: Locate the Interrupt Handler
Most network card driver code lives in the drivers/net/ethernet directory. e1000 is no exception: drivers/net/ethernet/intel/e1000/.
Here's the code that sets up the network card's hardware interrupt:
// drivers/net/ethernet/intel/e1000/e1000_main.c
static int e1000_request_irq(struct e1000_adapter *adapter)
{
    struct net_device *netdev = adapter->netdev;
    irq_handler_t handler = e1000_intr;
    […]
    err = request_irq(adapter->pdev->irq, handler,
                  irq_flags, netdev->name, netdev);
    […]
(By the way, here's a shortcut for viewing code online: Bootlin's LXR. Tools like this are absolute lifesavers when browsing source code.)
As you can see, the hardware interrupt handler is named e1000_intr(). Its signature is:
static irqreturn_t e1000_intr(int irq, void *data);
The code is located here: e1000_intr source.
Step 3: Let's Do It
Fire it up directly with our helper script:
# ./kp_load.sh --mod=/lib/modules/5.10.60-prod01/kernel/drivers/net/ethernet/intel/e1000/e1000.ko --probe=e1000_intr --verbose --showstack
Pay close attention to the arguments we pass to the script. Figure 4.7 shows the script's execution process:
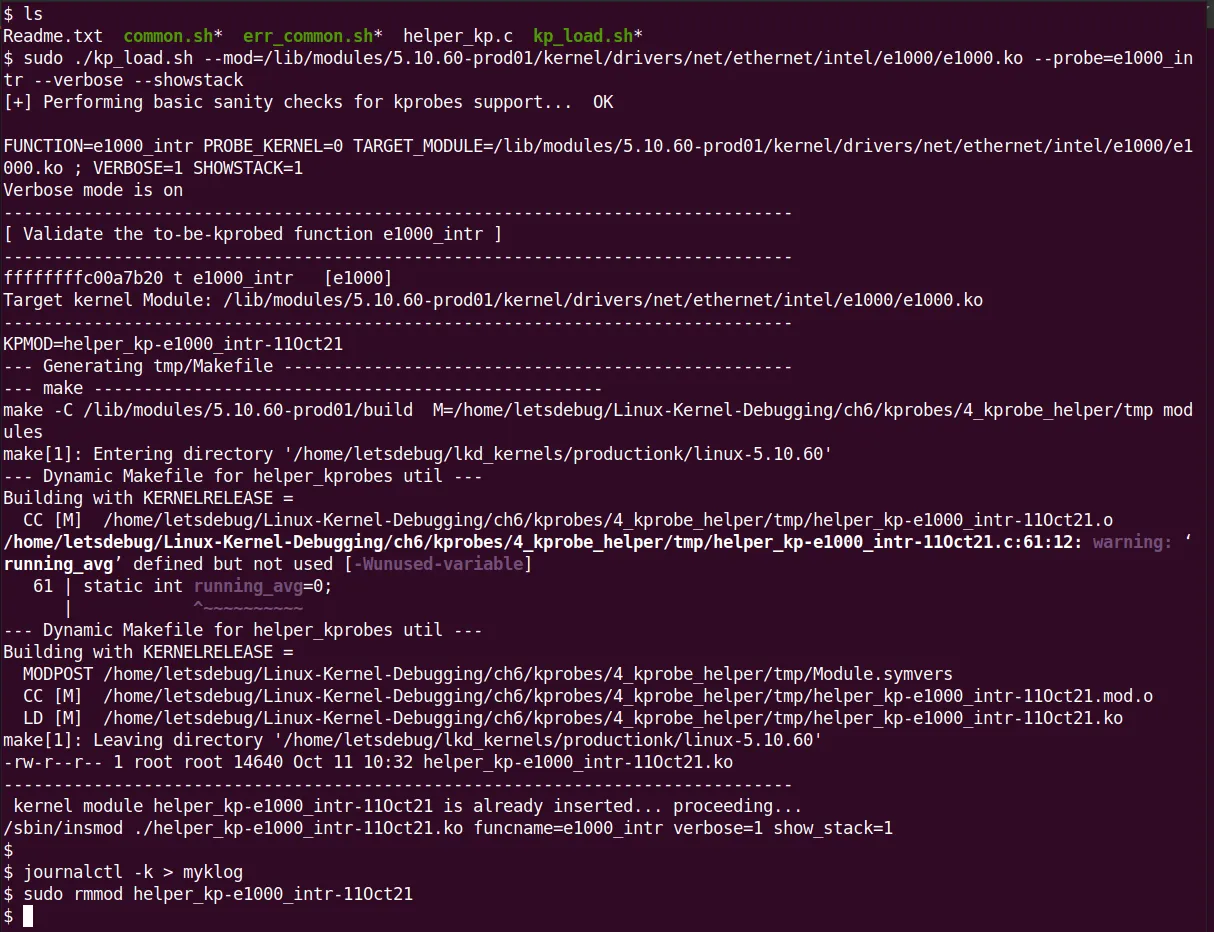
Figure 4.7 – Screenshot of the kp_load.sh helper script executing and loading a custom kprobe LKM
Behind the scenes, the script quietly did all of this: performed health checks, verified the function (even displaying its kernel virtual address via /proc/kallsyms), created a temporary folder (tmp/), copied the C template file (helper_kp.c) in and renamed it, generated a Makefile using a HERE document, switched in to compile the module, and finally inserted it into the kernel with insmod. All in one smooth flow.
Step 4: Check the Results
I saved the kernel log to a file (journalctl –k > myklog), then unloaded the module and opened the log with vi. The output is quite large; Figure 4.8 shows a partial screenshot. You can see our custom kprobe's pre-handler printk, the output from the PRINT_CTX() macro, and the most exciting part — the output from dump_stack()! The last two lines are from the post handler:
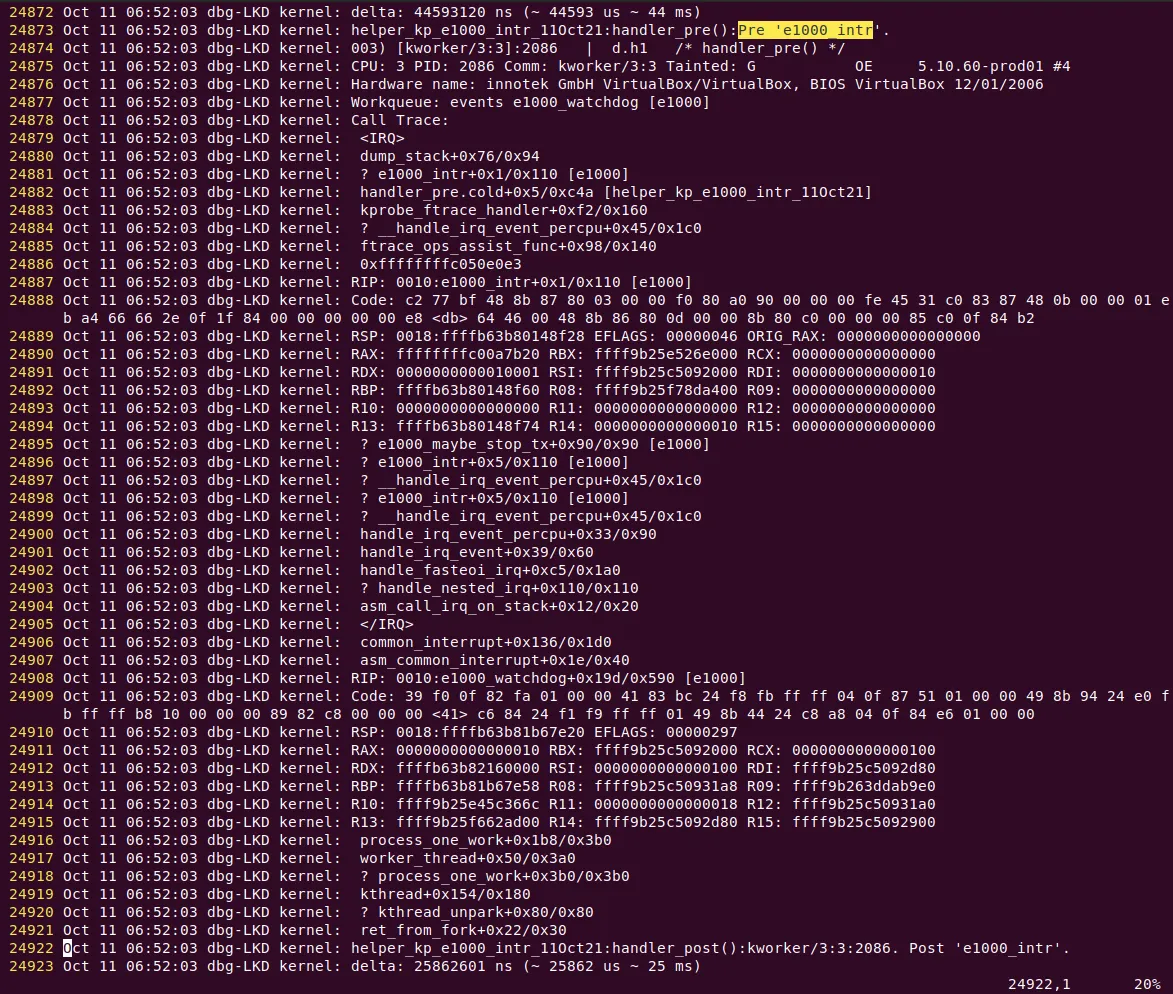
Figure 4.8 – Partial screenshot of kernel logs showing the helper script-generated kprobe output in the pre-handler; the last two lines are from the post handler
Pretty cool! Our auto-generated kprobe actually worked.
Don't be intimidated by that massive stack trace — we'll cover how to interpret kernel stacks in detail in later chapters. For now, let's focus on a few key points in Figure 4.8 (ignoring line numbers and the first five columns on the left):
-
Line 24873: This is the output from our custom kprobe. Because the verbose flag is on, the debug printk shows the call site —
helper_kp_e1000_intr_11Oct21:handler_pre():Pre 'e1000_intr'. -
Line 24874: This is the output from the
PRINT_CTX()macro —003) [kworker/3:3]:2086 | d.h1 /* handler_pre() */. That string ofd.h1characters can be interpreted by cross-referencing Figure 4.4: hardware interrupts are disabled, we're in hard interrupt context, and we currently hold a spinlock. -
Lines 24875 to 24921: This is the output from
dump_stack(), which contains a massive amount of information. For now, just read it bottom-up and ignore the lines starting with?. Here's an interesting point: did you notice that this actually shows two separate kernel stacks?-
The upper portion is wrapped in
<IRQ>and</IRQ>labels. This tells us this is the IRQ stack — a special stack area dedicated to handling hardware interrupts (this is an architecture-specific optimization called interrupt stacks, used by most modern processors). -
The lower portion, the part after
</IRQ>, is the regular kernel stack. It typically belongs to the unlucky process context that got interrupted (in this case, it happens to be a kernel thread namedkworker/3:3).
-
🧠 Bonus Tip: How to Interpret kthread Names Kernel thread names (like the
kworker/3:3seen here) follow a specific format:kworker/%u\:%d[%s](i.e., kworker/cpu:id[priority]). For details, refer to the kernel documentation: Documentation/kernel-per-CPU-kthreads.txt.
Using this helper script certainly saves a lot of effort. Of course, there's a trade-off — there's no such thing as a free lunch. Our helper_kp.c C code template is hardcoded, meaning no matter what function you probe, the generated module code structure is always the same. That's the trade-off.
Now you've learned how to write static kprobes; more importantly, you know how to leverage this technique to precisely "instrument" your kernel/module code, even in production environments!
On the flip side of the coin is the kretprobe (return probe). Let's go see what it can do.