5.5 Catching Bugs with KASAN
Assume you have already followed the detailed steps from the previous section to configure, compile, and successfully boot a debug kernel with KASAN enabled. In my environment—an x86_64 Ubuntu 20.04 LTS virtual machine—everything is ready to go.
Now that we have our eyes installed, we need to find something for them to look at.
To verify that KASAN is actually working, we need to execute some code that contains memory bugs (I can almost hear some veterans in the audience smirking: "Ha, how hard can that be? Just grab any piece of code"). True, we could easily hand-write a few test cases, but since the wheel has already been invented, why reinvent it? This is a perfect opportunity to get familiar with the kernel's testing infrastructure. In the following section, we will look at how to leverage the kernel's KUnit unit testing framework to run KASAN test cases.
Running KASAN Tests Using the Kernel's KUnit Infrastructure
Since the community has already written the test cases for us, why bother writing our own? This is the beauty of open source.
The Linux kernel has evolved to become quite comprehensive, incorporating various testing infrastructures, including mature test suites. To test a certain aspect of the kernel today, you usually just need to configure the right kernel options and run the tests.
Among the kernel's many built-in testing frameworks, there are two main ones: the KUnit framework and the kselftest framework. By the way, the official kernel documentation of course has all the details. As a starting point, you can check out the "Kernel Testing Guide":
https://www.kernel.org/doc/html/latest/dev-tools/testing-overview.html
It provides a rough overview of the testing frameworks and tools available in the kernel (including dynamic analysis tools).
Additionally, there are several related and useful frameworks: kernel fault injection, notifier error injection, Linux Kernel Dump Test Module (LKDTM), and so on. You can find them under the Kernel hacking | Kernel Testing and Coverage menu in the kernel configuration.
We don't plan to dive deep into how KUnit works here; our goal right now is simply to use it as a practical example to test KASAN. For details on how to use these testing frameworks (which prove to be very useful!), you can refer to the links in the "Further reading" section at the end of the chapter.
Getting back on track, to get our hands dirty and get familiar with it, let's use the kernel's KUnit (Kernel Unit Testing) framework to execute KASAN test cases.
This is actually quite simple. First, ensure your debug kernel has KUnit enabled:
CONFIG_KUNIT=y (or CONFIG_KUNIT=m).
Since we want to run the KASAN test cases, we must also select the KASAN test module:
CONFIG_KASAN_KUNIT_TEST=m
The kernel code for the KASAN test module we are about to run is located at lib/test_kasan.c. Taking a quick glance at the code, you will see various test cases defined inside (quite a few—38 at the time of writing this):
// lib/test_kasan.c
static struct kunit_suite kasan_kunit_test_suite = {
    .name = "kasan",
    .init = kasan_test_init,
    .test_cases = kasan_kunit_test_cases,
    .exit = kasan_test_exit,
};
kunit_test_suite(kasan_kunit_test_suite);
This code sets up a group of test suites to be executed. The actual test cases reside in the test_cases member of the kunit_suite structure. It is a pointer to an array of kunit_case structures:
static struct kunit_case kasan_kunit_test_cases[] = {
    KUNIT_CASE(kmalloc_oob_right),
    KUNIT_CASE(kmalloc_oob_left),
    [...]
    KUNIT_CASE(kmalloc_double_kzfree),
    KUNIT_CASE(vmalloc_oob),
    {}
};
The KUNIT_CASE() macro is responsible for setting up an individual test case. To help you understand how it works, let's look at the code for the first test case:
// lib/test_kasan.c
static void kmalloc_oob_right(struct kunit *test)
{
    char *ptr;
    size_t size = 123;

    ptr = kmalloc(size, GFP_KERNEL);
    KUNIT_ASSERT_NOT_ERR_OR_NULL(test, ptr);
    KUNIT_EXPECT_KASAN_FAIL(test, ptr[size + OOB_TAG_OFF] = 'x');
    kfree(ptr);
}
Very intuitive, the actual checks happen in the KUNIT_ASSERT|EXPECT_*() macros you see here.
The first macro asserts that the return value of the kmalloc() API is neither an error nor NULL.
The second macro, KUNIT_EXPECT_KASAN_FAIL(), tells the KUnit code to expect a failure—this is a negative test case. This is exactly what we want: we expect that writing out-of-bounds to the right side of a buffer (a write overflow defect) will trigger KASAN and report a failure! If you are interested, you can dig into the implementation details of these macros.
Additionally, a very interesting point: the name and exit members in the kunit_suite structure specify the functions to be executed before and after each test case runs. This module leverages this mechanism to ensure that the kernel sysctl kasan_multi_shot is temporarily enabled, and panic_on_warn is set to 0 (otherwise, only the first illegal memory access would trigger a report and potentially crash the kernel!).
Finally, let's give it a try:
$ uname -r
5.10.60-dbg01
$ sudo modprobe test_kasan
This causes all test cases in the KASAN test module to be executed! Checking the kernel logs (via journalctl -k or dmesg), you will see detailed KASAN reports for each test case. Since the output is quite massive, I will only capture a portion. The first test case—KUNIT_CASE(kmalloc_oob_right)—caused KASAN to generate the following report (output is truncated—there is more to follow):
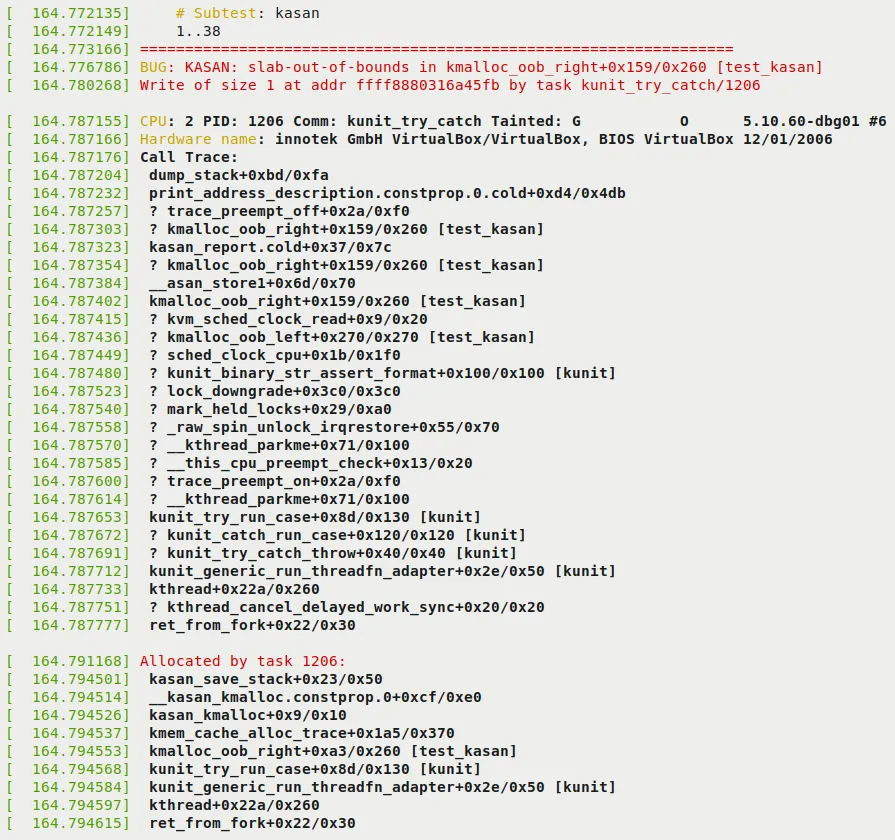
Figure 5.2 – Part 1 of the KUnit KASAN bug-catching example
Note a few key points in the preceding figure:
-
In the first two lines, KUnit displays the test title (i.e.,
# Subtest: kasan) and indicates that it is about to run test cases 1..38. -
As expected, KASAN successfully detected the memory defect (write overflow) and generated a report. The report starts with
BUG: KASAN: [...], followed by the details. -
The next few lines reveal the root cause. KASAN displays the offending function in the format
func()+0xoff_from_func/0xsize_of_func. This indicates that in a function namedfunc(), the error occurred at an offset of0xoff_from_funcbytes from the start of the function, and the kernel estimates the function length to be0xsize_of_funcbytes. So here, the code in thekmalloc_oob_right()function within kernel moduletest_kasan(shown in the rightmost square brackets), at an offset of0x159bytes from its start (followed by an educated guess that the function is0x260bytes long), attempted to illegally write to a specified address. This defect, the bug, is an OOB write to a slab memory buffer, as indicated by theslab-out-of-boundsmarker we see:BUG: KASAN: slab-out-of-bounds in kmalloc_oob_right+0x159/0x260 [test_kasan]Write of size 1 at addr ffff8880316a45fb by task kunit_try_catch/1206 -
The line below shows the process context in which this happened (we will cover the meaning of the tainted flag in the next chapter):
CPU: 2 PID: 1206 Comm: kunit_try_catch Tainted: G O 5.10.60-dbg01 #6 -
The next line shows the hardware details (you can tell this is a VM, VirtualBox).
-
The bulk of the output is the call stack (marked as
Call Trace:). If you read from bottom to top (and ignore lines prefixed with?), you can clearly see how the control flow reached the buggy code! -
The
Allocated by task 1206:line and subsequent output show the call trace of the memory allocation code path. This is extremely helpful because it shows who originally allocated this memory buffer and where.
The remainder of the output can be seen in the following figure:
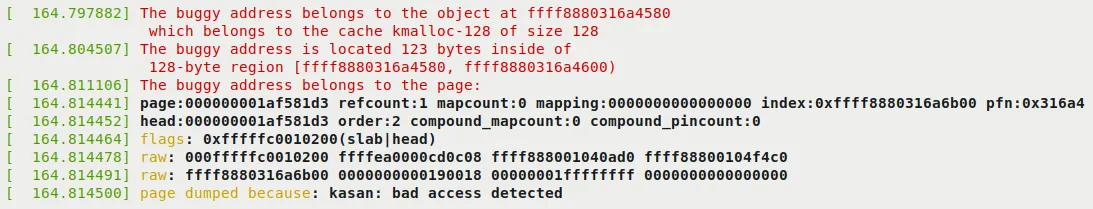
Figure 5.3 – Part 2 of the KUnit KASAN bug-catching example
Since we previously recommended enabling CONFIG_PAGE_OWNER=y when configuring Generic KASAN mode (see the Configuring the kernel for Generic KASAN mode section), the following output will also appear. It gives you insight into where the page that suffered the illegal access resides and its ownership information:
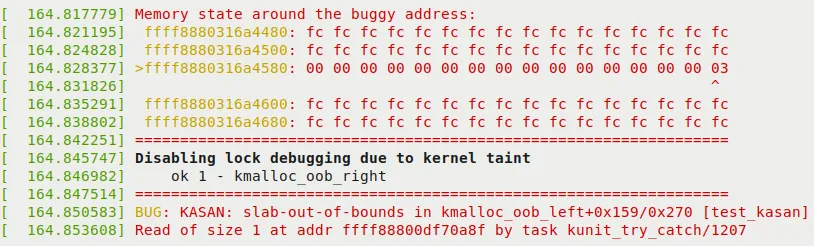
Figure 5.4 – Part 3 (and final) of the KUnit KASAN bug-catching example
In the preceding figure, you can see KASAN proving its case. It displays the actual memory region where the defect occurred, and even precisely points out the offending byte (via the > at the beginning of the line and the ^ symbol on the column!). As a side effect of this bug, the kernel has now disabled all lock debugging. Furthermore, KUnit indicates that running the first test case went smoothly: ok 1 - kmalloc_oob_right.
Understanding this information is crucial. It helps you peel back the layers and find the true culprit that triggered the bug. We will decode this line of output in detail in the next section!
Decoding the KASAN Shadow Memory Output
In Figure 5.4, you can see the KASAN shadow memory revealing the cause of the defect. Let's print out the key line—the one with the right arrow > prefix:
>ffff8880318ad980: 00 00 00 00 00 00 00 00 00 00 00 00 00 00 00 03
                  ^
These are the KASAN shadow memory bytes, where each byte represents 8 bytes of actual memory. The byte being pointed to (the ^ symbol) 03 tells us where the problem lies. So what do bytes like 00 and 03 actually mean? Here are the details:
-
Generic KASAN allocates one shadow byte to track 8 bytes of kernel memory (you can think of this 8-byte region as a memory granule).
-
A granule (8-byte region) is encoded as either: accessible, partially accessible, part of a redzone, or freed.
-
The rules for encoding memory granules (8-byte regions) via shadow byte tracking are as follows:
- Shadow memory = 00: All 8 bytes are accessible (no problem).
- Shadow memory = N (where N can be a value between 1 and 7): The first N bytes are accessible (legal); the remaining
8 - Nbytes are legally inaccessible. - Shadow memory < 0: A negative value means the entire granule (8 bytes) is inaccessible. The specific (negative) values and their meanings (freed memory, redzones, etc.) are encoded in the header file
mm/kasan/kasan.h.
Now you should understand that a shadow byte of 03 means this memory is partially accessible. The first 3 bytes (where N = 3) are legally accessible; the remaining 5 bytes (8 - 3 = 5) are not. Let's take the trouble to verify this in detail. Of course, the code line that triggered the bug is right here (located in the kernel codebase):
// lib/test_kasan.c
static void kmalloc_oob_right(struct kunit *test)
    [...]
    size_t size = 123;
    ptr = kmalloc(size, GFP_KERNEL);
    [...]
    KUNIT_EXPECT_KASAN_FAIL(test, ptr[size + OOB_TAG_OFF] = 'x');
Now, the variable size is set to the value 123, and OOB_TAG_OFF is 0 when CONFIG_KASAN_GENERIC is enabled. So, effectively, this (buggy) code is equivalent to:
ptr[123] = 'x';
The Generic KASAN memory granule size is 8 bytes. So, out of the 123 allocated bytes, the 15th memory granule (8 * 15 = 120) is exactly what we are targeting for the write. The following diagram clearly illustrates the memory buffer and how it gets overflowed:
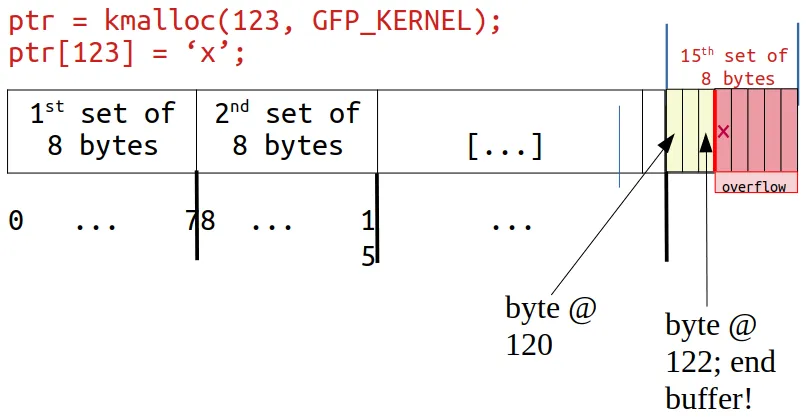
Figure 5.5 – The kmalloc-allocated memory (slab) buffer overflows
Look closely: on the right end, byte positions 120, 121, and 122 are legal and can be read/written, but our KUnit KASAN test case deliberately writes to byte position 123—which is 1 byte past the end of the slab buffer. This is a clear OOB write overflow violation, and KASAN caught it!
Not only that, as Figure 5.4 and Figure 5.5 clearly show, the kernel is smart enough to display the shadow value here as 03, meaning the first 3 bytes are valid, but the remaining 5 are not—which is exactly the case!
Furthermore, the surrounding bytes are set to the value 0xfc (see Figure 5.4). What does this mean? A quick look at the header file reveals it—it's a redzone inside the kernel SLUB object:
// mm/kasan/kasan.h
#ifdef CONFIG_KASAN_GENERIC
#define KASAN_FREE_PAGE         0xFF  /* page was freed */
#define KASAN_PAGE_REDZONE      0xFE  /* redzone for kmalloc_large allocations */
#define KASAN_KMALLOC_REDZONE   0xFC  /* redzone inside slub object */
#define KASAN_KMALLOC_FREE      0xFB  /* object was freed (kmem_cache_free/kfree) */
#define KASAN_KMALLOC_FREETRACK 0xFA  /* object was freed and has free track set */
Returning to our interpretation of Figure 5.4: the next line (BUG: KASAN: [...]) just tells you it's moving on to run the next test case... KASAN now catches the bug in the second test case (KUNIT_CASE(kmalloc_oob_left)). The kernel log contains the same information as the first defect: the KASAN bug summary, the dump_stack() output (call stack frames), who performed the allocation, page ownership information, and the memory state around the bug's access address. This continues all the way to the thirty-eighth test case—perfectly!
A quick check of the kernel log reveals exactly what we expected—the kernel's KUnit KASAN test case module caught all 38 memory-defective test cases:
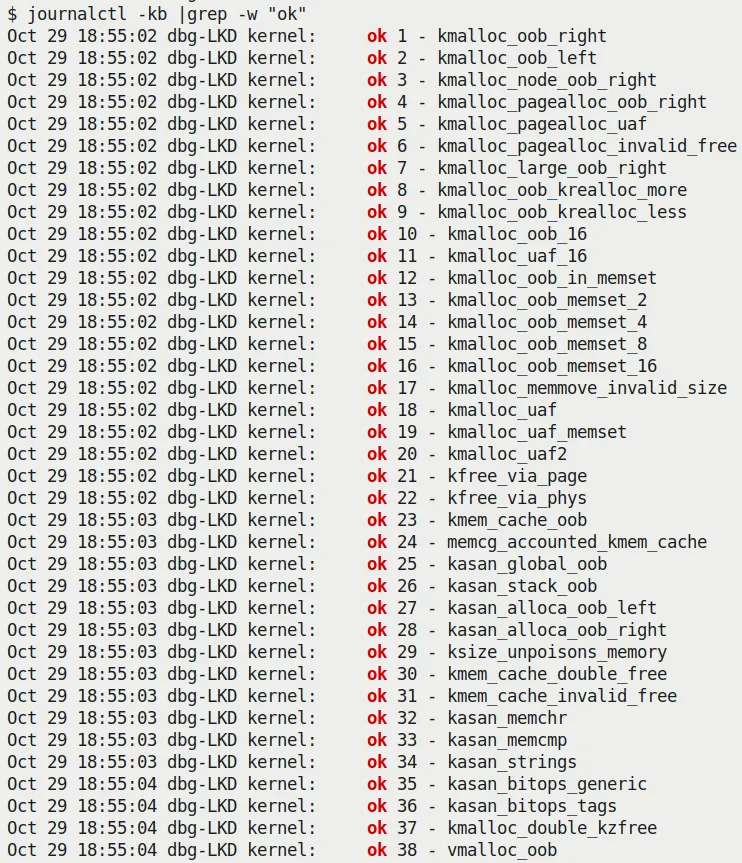
Figure 5.6 – Screenshot showing the kernel's KUnit KASAN test module catching all 38 memory-defective test cases
As you can clearly see from the preceding screenshot, all 38 test cases are reported as ok (passed).
Exercise Be sure to perform the steps we just did on your machine—run the kernel's KUnit KASAN test cases. Observe the various KASAN test cases from the kernel logs and verify that they all ran correctly.
By the way, notice this:
$ lsmod |egrep "kunit|kasan"
test_kasan             81920  0
kunit                  49152  1 test_kasan
In my specific environment, you can see from the lsmod output that KUnit is configured as a kernel module.
You can learn how to write your own KUnit test suites. For more on using KUnit, be sure to check out the "Further reading" section!
Remaining Tests Using Our Custom Buggy Kernel Module
Did you notice that despite running all the KASAN KUnit test cases, there seem to be a few common memory defects (which we mentioned in Chapter 4 and in the What's the problem with memory anyway? section of this chapter) that are not covered by the KUnit test cases?
- Uninitialized Memory Read (UMR) bugs
- Use-After-Return (UAR) bugs
- Simple memory leak bugs (we will discuss memory leaks in more detail later in this chapter)
So, I wrote a kernel module to execute these test cases (of course, running on a debug kernel with Generic KASAN enabled), along with a few more interesting ones. To test against KASAN, remember to boot via your custom debug kernel, which obviously needs to include CONFIG_KASAN=y.
Due to space constraints, I won't show the entire test module code here (please refer to this book's GitHub repository and read the comments within it—you can find it under the ch5/kmembugs_test folder). To give you a taste, let's look at one of the test cases and how it is invoked. Here is the code for the UAR test case:
// ch5/kmembugs_test/kmembugs_test.c
/* The UAR - Use After Return - testcase */
static void *uar(void)
{
    volatile char name[NUM_ALLOC];
    volatile int i;
    pr_info("testcase 2: UAR:\n");
    for (i=0; i<NUM_ALLOC-1; i++)
        name[i] = 'x';
    name[i] = '\0';
    return name;
}
This module is designed to be loaded via a bash script named load_testmod, and the test cases are run interactively (via a bash wrapper script named run_tests). The run_tests script (which you must run as root) displays a menu of available tests and prompts you to enter the corresponding number to select one. You can see a screenshot of the menu in Figure 5.8 (in the next section)—so you can also see all the test cases you can try.
The script then writes this number to our debugfs pseudo-file: /sys/kernel/debug/test_kmembugs/lkd_dbgfs_run_testcase. The debugfs write hook function then receives this data from user space, validates it, and invokes the appropriate test case routine (via a long if-else ladder). This design allows you to test interactively and execute any test case as many times as you wish.
The following code snippet shows how our debugfs module code invokes the preceding uar() test case:
// ch5/kmembugs_test/debugfs_kmembugs.c
static ssize_t dbgfs_run_testcase(struct file *filp, const char __user *ubuf,
                                  size_t count, loff_t *fpos)
{
    char udata[MAXUPASS];
    volatile char *res1 = NULL, *res2 = NULL;
    [...]

    if (copy_from_user(udata, ubuf, count))
        return -EIO;
    udata[count-1]='\0';
    pr_debug("testcase to run: %s\n", udata);
    /* Now udata contains the data passed from userspace - the testcase # to run (as a string) */
    if (!strncmp(udata, "1", 2))
       umr();
    else if (!strncmp(udata, "2", 2)) {
       res1 = uar();
       pr_info("testcase 2: UAR: res1 = \"%s\"\n",
res1 == NULL ? "<whoops, it's NULL; UAR!>" : (char *)res1);
    } else if (!strncmp(udata, "3.1", 4))
...
Obviously, this—test case #2—is a defect, a bug. You know that local variables are only valid during their lifetime—that is, during the function's execution. This is because local (or automatic) variables are allocated on the executing process context's (kernel-mode) stack frame. Therefore, once you go out of the scope of the containing function, you must stop referencing that local variable. We (deliberately) didn't do that! We tried to retrieve it as a return value. The problem is, by that time, it's already gone...
However, before diving into running these test cases (though there's no reason not to run them right now), let's take a detour and talk about an interesting dilemma: how a known bug (like our UAR) can sometimes appear to run perfectly fine.
Stale Stack Frames – Trouble in Paradise
The most magical (or rather, craziest) thing about a bug like UAR is that the code can sometimes appear to run perfectly fine! How is this possible?
Here is how it works: the memory that holds the contents of local (automatic) variables resides on the stack. While we colloquially say that stack frames are allocated on function entry and destroyed on function return (the so-called function prologue and epilogue), reality is not quite that dramatic.
The reality is that memory is typically allocated at page-level granularity. This includes memory for stack pages. Therefore, once a page of memory is allocated for the stack, it is usually enough to hold several frames (of course, this depends on the specifics). Then, when more stack memory is needed, the stack grows (by allocating more pages, growing downward because the stack grows downward). The system keeps track of where the top of the stack is by having the Stack Pointer (SP) register track this memory location. Additionally, you need to realize that the so-called "top of the stack" is usually the lowest valid address. Thus, when frames are allocated and/or functions are called, the value of the SP register decreases. When a function returns, the stack shrinks by adding a value to the SP register (remember, this is a downward-growing stack!). The following diagram shows what a typical kernel-mode stack looks like on a Linux system (32-bit):
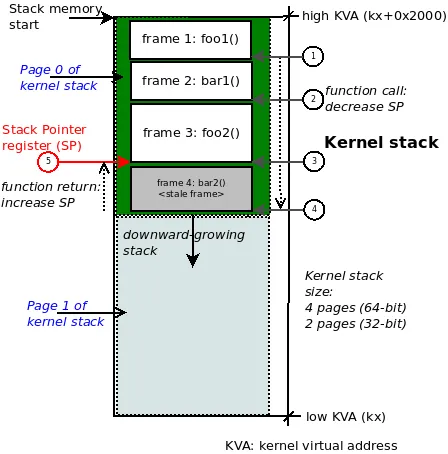
Figure 5.7 – Typical kernel-mode stack diagram on 32-bit Linux; function call chain: foo1() -> bar1() -> foo2() -> bar2()
So, it is entirely possible for this to happen: a stale stack frame (and the corresponding data within it) exists below valid frames and might be successfully referenced—even later on—without the system throwing a memory error!
Study Figure 5.7 carefully. For example, we show the kernel-mode stack on a 32-bit Linux system, so the kernel stack size will be 2 pages, typically 8 KB. Now, suppose the executing process context (within the kernel) called these functions in the following order (this is the call chain, circle steps 1 through 4 in the figure):
foo1() --> bar1() --> foo2() --> bar2()
Imagine we are now at the leaf node, which in this example is the function bar2(). It returns (circle step 5 in the preceding figure). This causes the SP register to increase back to the address representing the call frame of function foo2(). So, while the call stack memory for function bar2() still remains intact on the stack, it is effectively invalid. However, an erroneous (that is, buggy) access to it might still succeed.
This shouldn't happen in an ideal world, but hey, it's not a perfect world, right?! The lesson here is that we need tools—and clear thinking, which is the best tool of all—to catch tricky bugs like UAR!
Alright, back to our test cases! To run the tests, follow these steps:
-
Run the following command:
cd <book_src>/ch5/kmembugs_test -
Load the module:
./load_testmod[...]This should build the kernel module and load it into memory, with
dmesgshowing that the debugfs pseudo-file—<debugfs_mountpt>/test_kmembugs/lkd_dbgfs_run_testcase—has been created. -
Run our bash script to perform the tests:
sudo ./run_tests
The following screenshot shows that our test_kmembugs module was indeed loaded (done via our load_testmod script), the menu is displayed via the run_tests script, and we are running test case #2—the UAR bug:
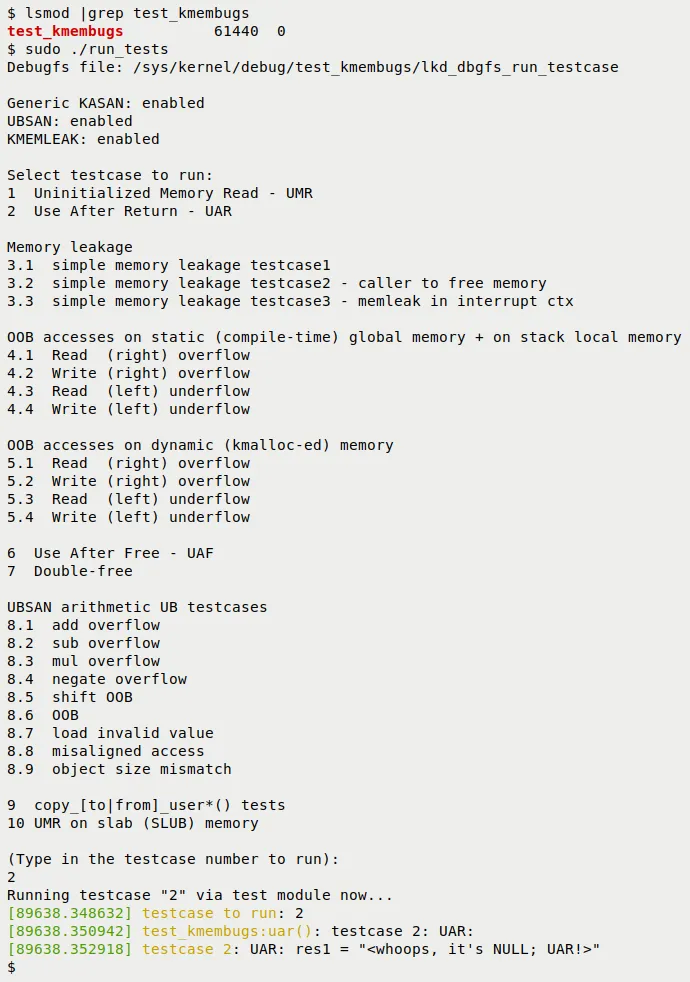
Figure 5.8 – Partial screenshot showing the build and output of our kmembugs_test LKM
Here is an example screenshot of our test case framework catching a left OOB write bug access via KASAN:
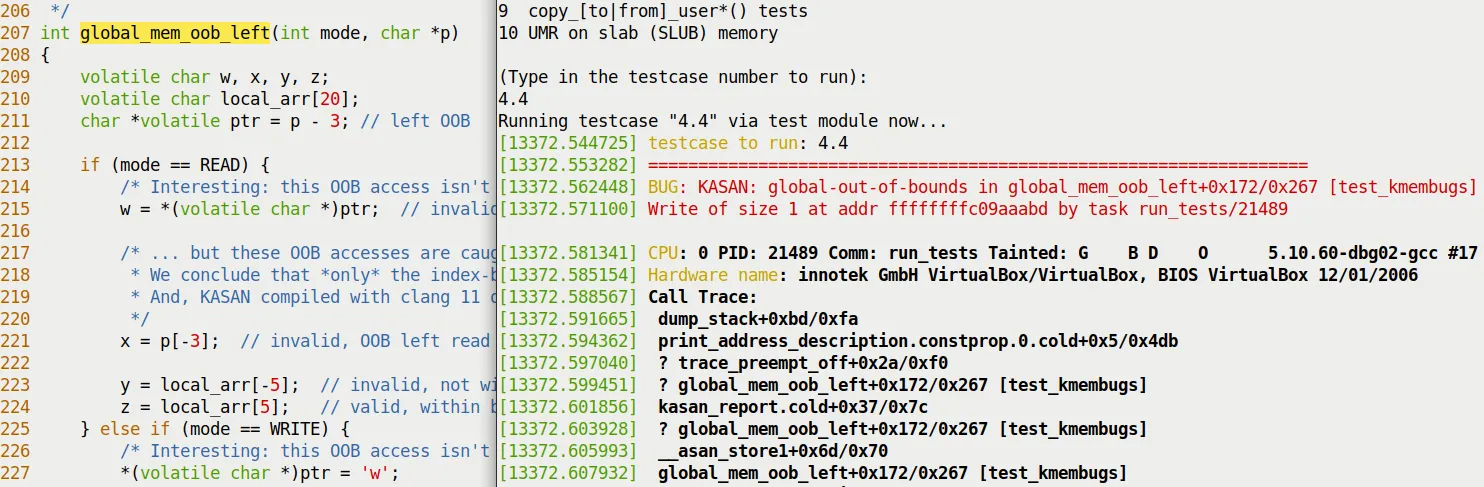
Figure 5.9 – Partial screenshot showing KASAN catching a left OOB bug when writing to global memory
A few things to realize:
-
First, the compiler, whether GCC or Clang, is smart enough to emit warnings for these (rather obvious) bugs. Both the UAR and UMR defects are indeed caught by them (at the exact location in the code where they occur), albeit as warnings! Here is one of the warnings GCC emitted for our UAR bug:
<...>/ch5/kmembugs_test/kmembugs_test.c:115:9: warning: function returns address of local variable [-Wreturn-local-addr]115 | return (void *)name;| ^~~~~~~~~~~~⚠️ This is important As a programmer, your job is to carefully heed all compiler warnings and—within human capability—fix them.
-
The script queries the kernel configuration file to see if your current kernel is configured with KASAN, UBSAN, and KMEMLEAK, and displays what it finds. It also shows the path to the debugfs pseudo-file where the test case number will be written (to invoke the test).
Here is a sample run of the UAR test case:
$ sudo ./run_tests
[...]
(Type in the testcase number to run):
2
Running testcase "2" via test module now...
[  144.313592] testcase to run: 2
[  144.313597] test_kmembugs:uar(): testcase 2: UAR:
[  144.313600] testcase 2: UAR: res1 = "<whoops, it's NULL; UAR!>"
$
- The output in the kernel log (seen via the preceding
dmesg) clearly states the situation: we executed the UAR test case, and neither the kernel nor KASAN caught it (if they had, the log would be full of complaints!). Our own code checks whether the variableres1is NULL and concludes that a UAR bug occurred. We can do this because we specifically initialized it to NULL and checked it after it was set to the string returned by the functionuar(); otherwise, we might not have caught it.
Alright, we have now done a few tests with KASAN. How is KASAN's report card looking? The next section will tell you.
KASAN – Summary Results Table
Exactly which memory corruption bugs (defects) can KASAN catch, and which can it not catch? Based on our test runs, we have summarized the results in the following table. Please study it carefully, along with the notes that follow:
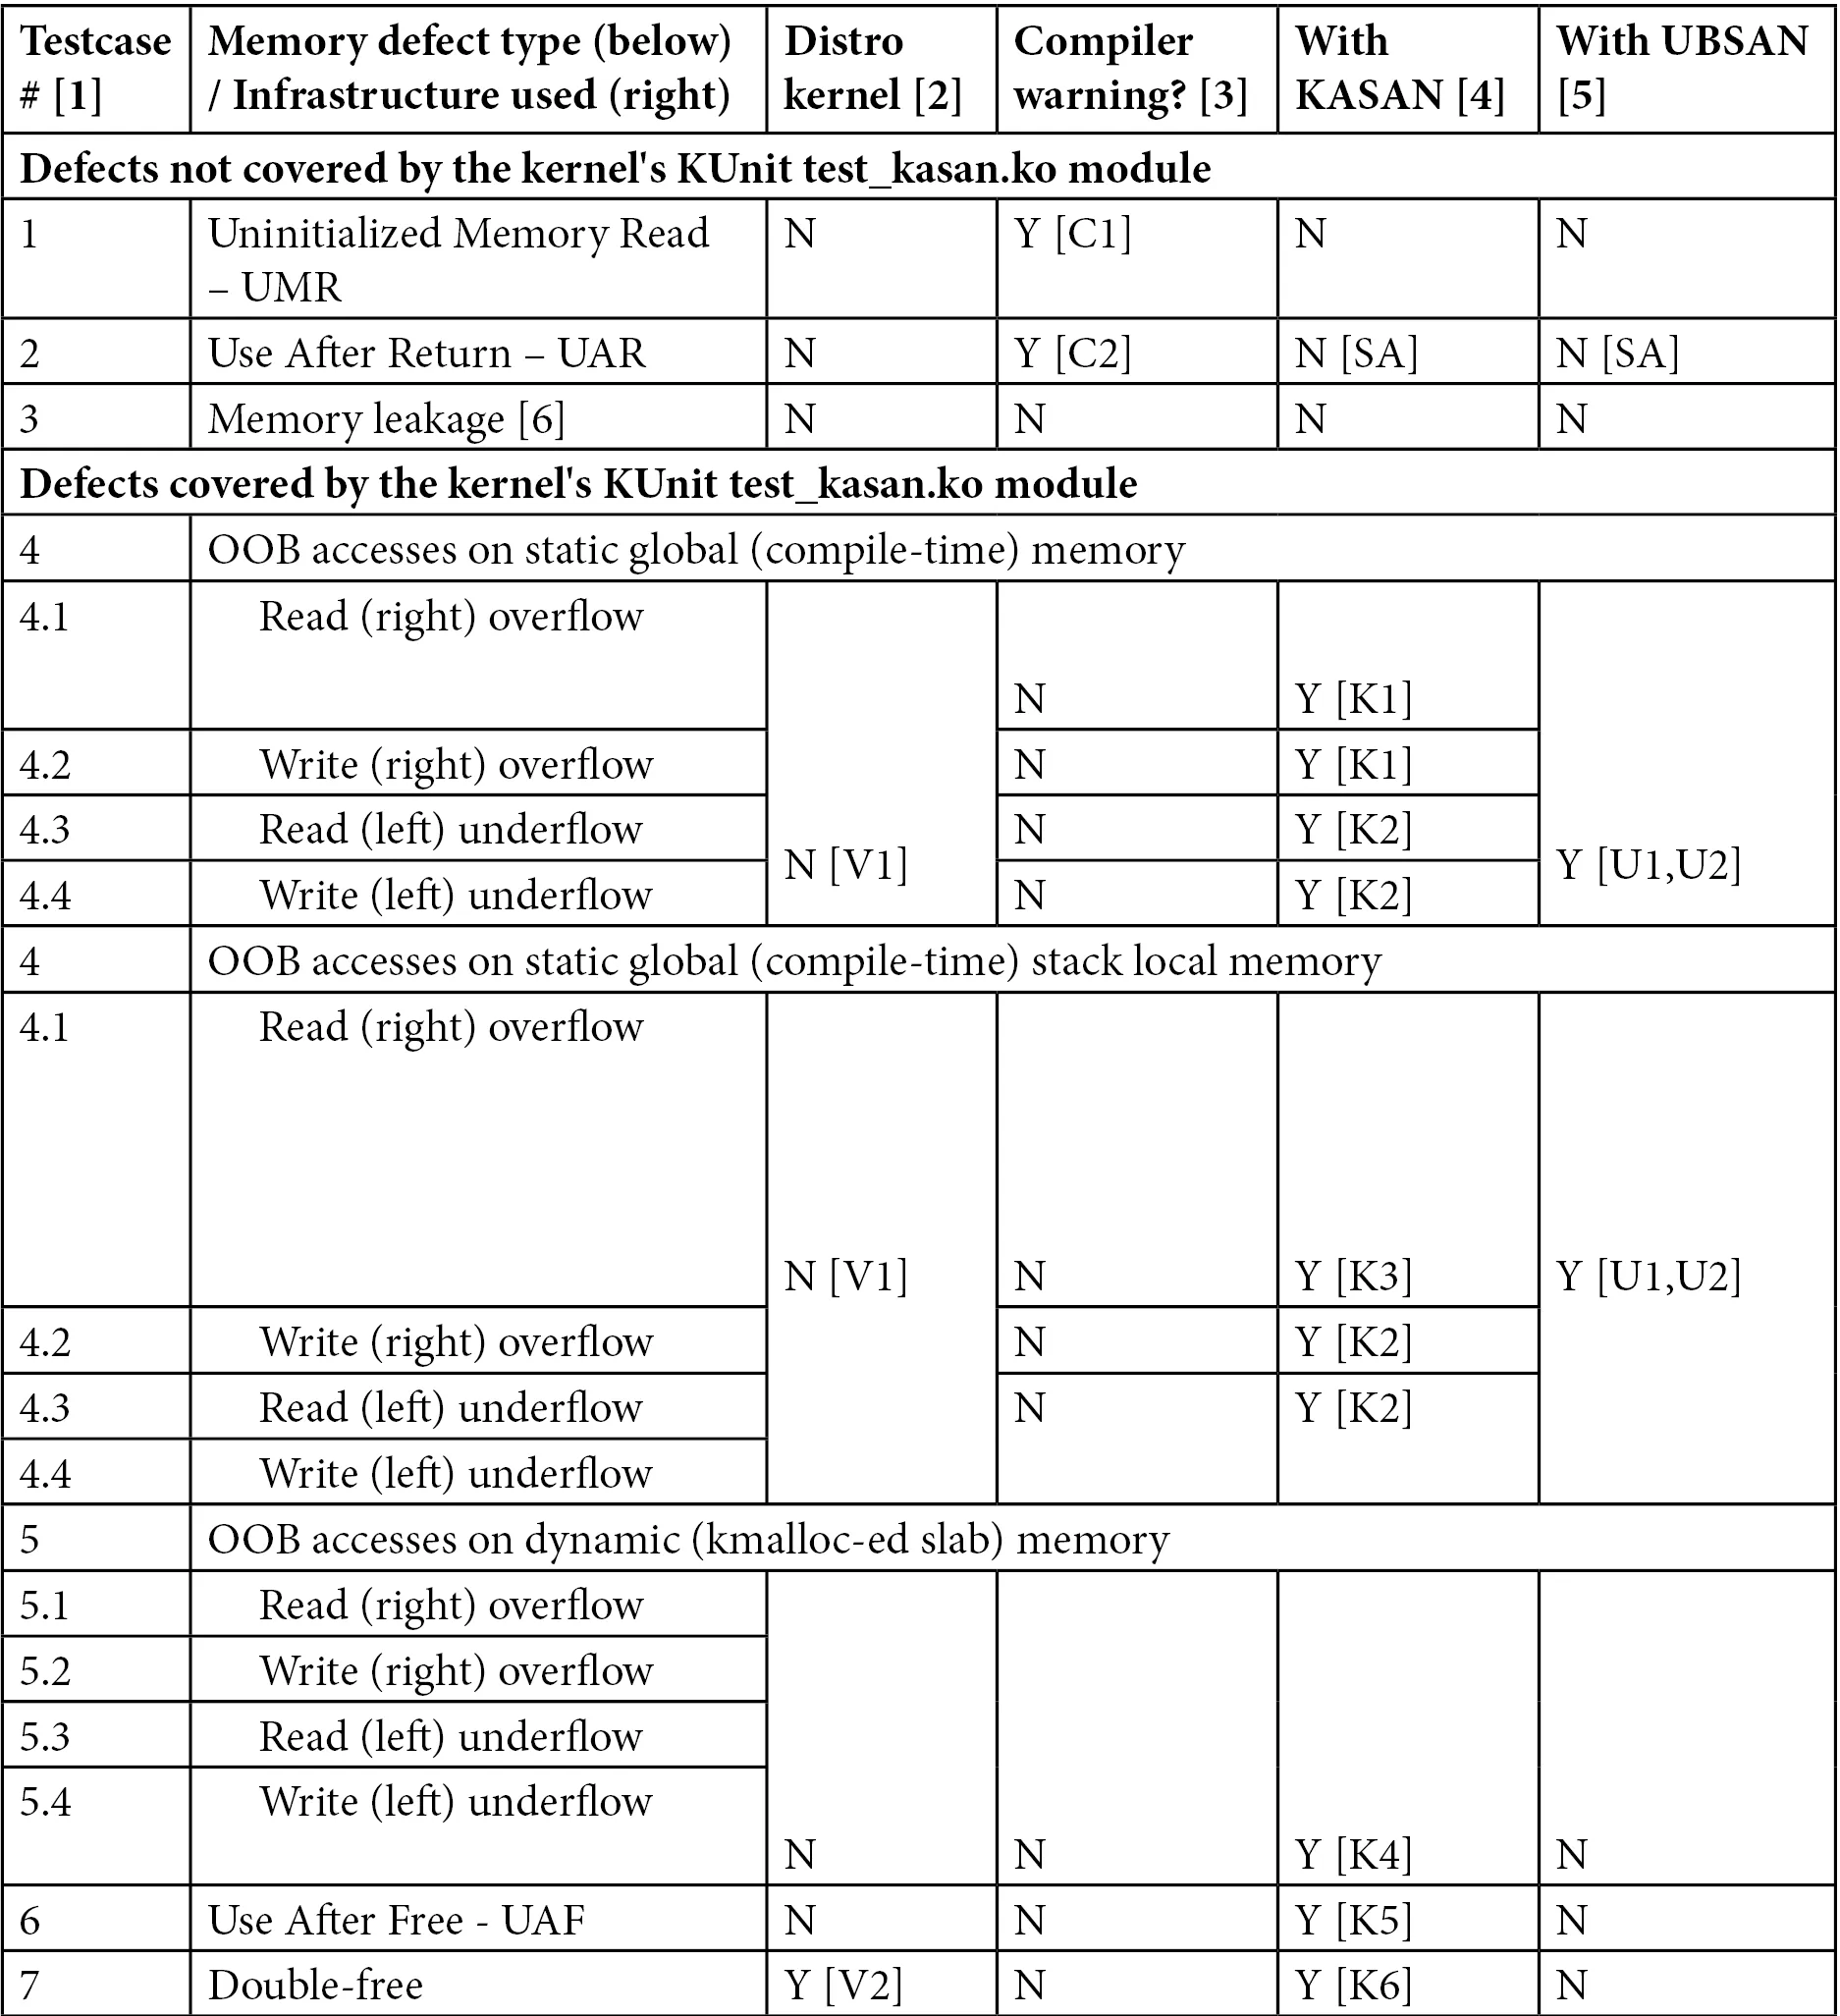
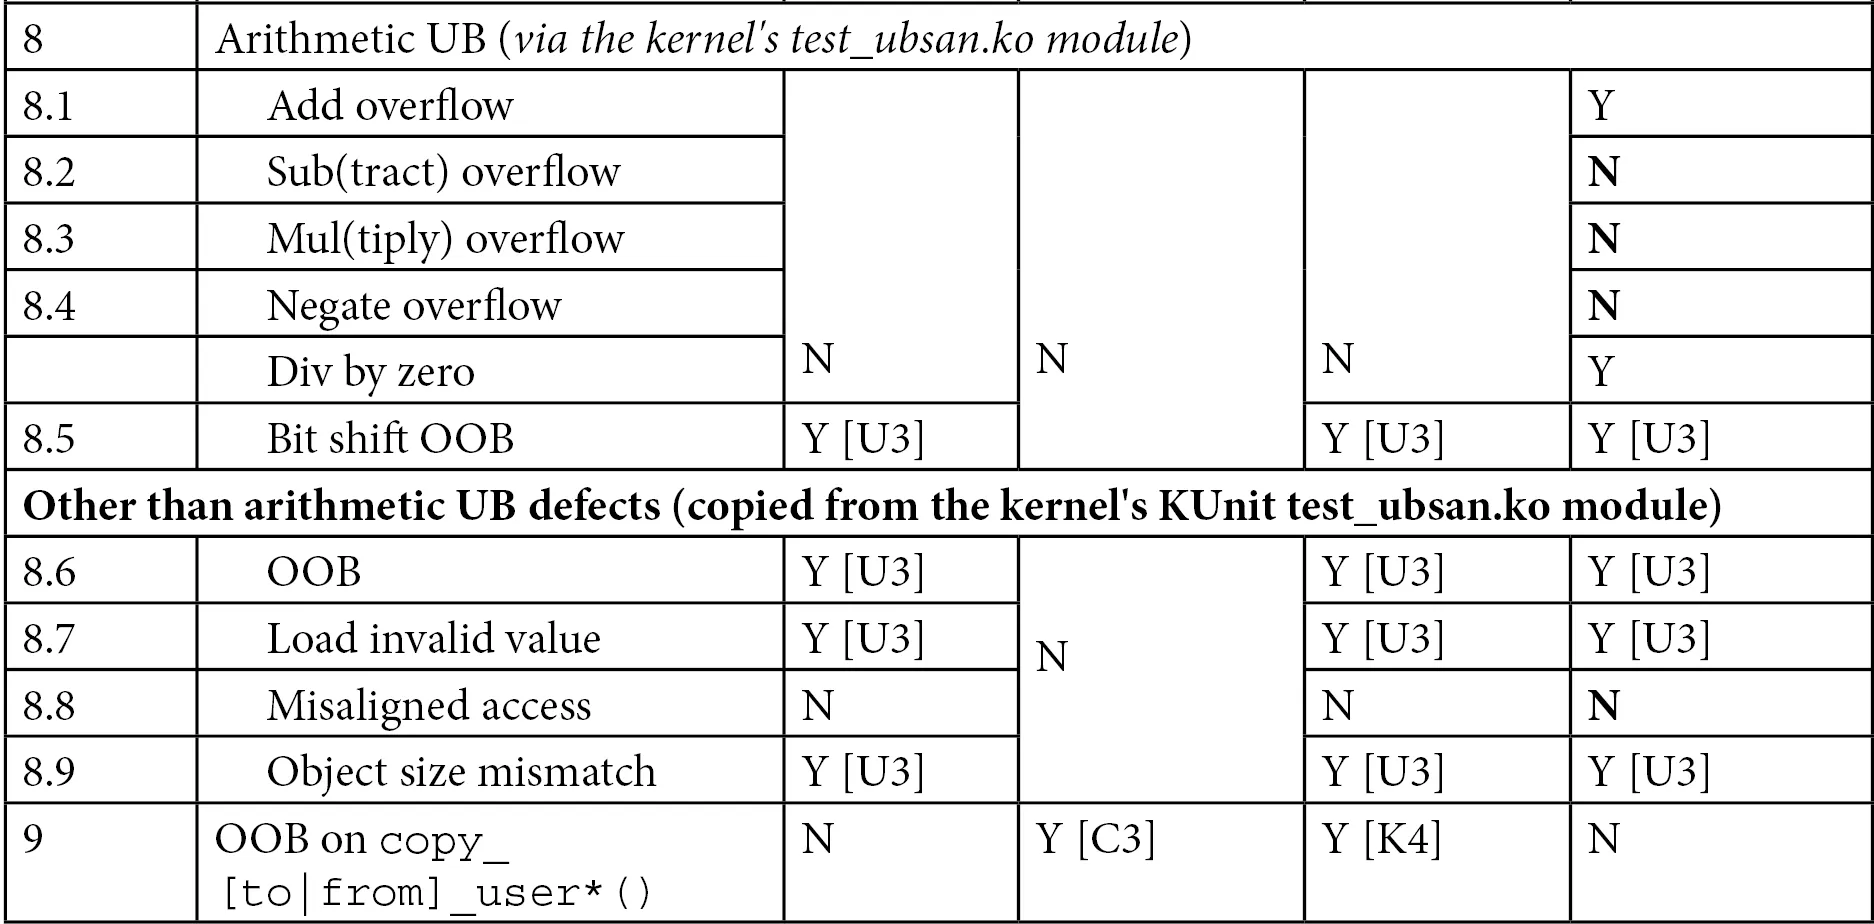
Table 5.3 – Summary of memory defects and arithmetic UB test cases caught (or not caught) by KASAN
You will find explanations for the footnote symbols seen in the table (such as [C1], [U1], etc.) below.
Test Environment
- [1] Test case numbers: Please refer to the test kernel module's source code—
ch5/kmembugs_test/kmembugs_test.c, the debugfs entry creation and usage indebugfs_kmembugs.c, and the bash scriptsload_testmodandrun_tests, all in the same folder. - [2] The compiler used here is GCC version 9.3.0 on x86_64 Ubuntu Linux. A later section - Using Clang 13 on Ubuntu 21.10 - will cover using the Clang 13 compiler.
- [3] To test KASAN, I had to boot via our custom debug kernel (5.10.60-dbg01), which includes
CONFIG_KASAN=yandCONFIG_KASAN_GENERIC=y. We assume the use of the Generic KASAN variant. - Test cases 4.1 to 4.4 operate on static (compile-time allocated global) memory as well as stack-local memory. This is why the test case numbers are 4.x in both.
Compiler Warnings
-
Version: This is for GCC version 9.3.0 on x86_64 Ubuntu:
-
[C1] The GCC compiler reports the UMR as a warning:
warning: '<var>' is used uninitialized in this function [-Wuninitialized] -
[C2] GCC reports the potential UAF defect as a warning:
warning: function returns address of local variable [-Wreturn-local-addr] -
[C3] GCC (quite smartly!) catches the illegal
copy_[to|from]_user()here. It figures out the destination size is too small:* In function 'check_copy_size',inlined from 'copy_from_user' at ./include/linux/uaccess.h:191:6,inlined from 'copy_user_test' at <...>/ch5/kmembugs_test/kmembugs_test.c:482:14:./include/linux/thread_info.h:160:4: error: call to '__bad_copy_to' declared with attribute error: copy destination size is too small160 | __bad_copy_to();| ^~~~~~~~~~~~~~~
-
-
When using the Clang 13 compiler (which we will cover in the Building the kernel and modules with Clang section), the warnings are almost exactly identical to GCC. Additionally, it emits
variable 'xxx' set but not used [-Wunused-but-set-variable].
The following section dives into the details—don't miss it!
KASAN – Detailed Notes on the Table Results
Here is a detailed explanation of the KASAN footnote symbols ([K1], [K2], etc.). It is important to read through all the notes, as we mention several caveats and edge cases:
-
[K1] KASAN catches and reports OOB accesses on global static memory in the following format:
global-out-of-bounds in <func>+0xstart/0xlen [modname]Read/Write of size <n> at addr <addr> by task <taskname/PID>The report will include either
ReadorWrite, depending on whether a read or write bug access occurred. -
[K2] There are quite a few caveats to mention here:
-
Out-Of-Bounds (OOB) read/write left underflow on global memory test cases are only caught when compiled with Clang version 11 or higher. GCC 10 or 11 cannot catch it either, due to how their redzones work.
-
KASAN only catches OOB accesses on global memory when compiled with Clang 11 and later! Therefore, in my test runs using GCC 9.3 and Clang 10, I saw it fail to catch read/write underflow (left OOB) accesses on global buffers (test cases 4.3 and 4.4)! However, for overflow defects on global memory, it does seem to catch them, though you shouldn't take this for granted... (by the way, Clang is pronounced "clang" and not "see-lang"). Furthermore, although the documentation claims support for GCC starting from version 8.3.0, in my testing, it failed to catch the read/write underflow bug test cases on (only) global memory. Be sure to read the upcoming Building the kernel and modules with Clang section!
-
However, even with GCC 9.3, depending on how its internal redzones and padding work, the first declared global variable (exactly which variable depends on how the linker lays things out) might not have a left redzone, causing left OOB bug accesses to be missed... This is why—as a silly workaround until GCC fixes this issue—we used three global arrays. In the test cases, we use the middle one as the test buffer (any one except the first will do). Hopefully, GCC will be fixed—to have proper redzones—so that all OOB accesses can be caught. In our specific test run, the left OOB bug access on global memory was indeed caught, even when compiled with GCC 9.3!
-
These observations, caveats, and so on, are inherently somewhat mystical at times. They might work one way on one system and quite differently on another system with a different configuration or architecture. Therefore, we strongly recommend that you test your workloads using a properly configured debug kernel combined with all the tools at your disposal (including using newer compiler technologies like Clang) and the various tools and techniques covered in this book. Yes, it's a lot of work, and yes, it's worth it!
-
-
[K3] KASAN catches and reports OOB accesses on stack-local memory in the following format:
stack-out-of-bounds in <func>+0xstart/0xlen [modname]Read/Write of size <n> at addr <addr> by task <taskname/PID> -
[K4] KASAN catches and reports OOB accesses on dynamic slab memory in the following format:
BUG: KASAN: slab-out-of-bounds in <func>+0xstart/0xlen [modname]Read/Write of size <n> at addr <addr> by task <taskname/PID> -
[K5] KASAN catches and reports UAF defects in the following format:
BUG: KASAN: use-after-free in <func>+0xstart/0xlen [modname]Read/Write of size <n> at addr <addr> by task <taskname/PID> -
[K6] KASAN catches and reports double frees in the following format:
BUG: KASAN: double-free or invalid-free in <func>+0xstart/0xlen [modname] -
In all the preceding cases, the KASAN report also details the actual violation, including the process context, the (kernel-mode stack) call trace, and the shadow memory mapping, showing which variable the OOB memory access belongs to (if applicable) and the memory state around the bug's address.
Tip – Consolidating all results into one table For your convenience, in Part 2 of this key topic (the next chapter), in the Catching memory defects in the kernel – comparisons and notes (Part 2) section, Table 6.4 summarizes the test case results for all the tool techniques we used in this chapter—vanilla/distro kernels, compiler warnings, KASAN, UBSAN, and SLUB debug. Essentially, it is a compilation of all findings, allowing you to quickly (and hopefully helpfully) compare them.
Did you notice that, regarding the kernel's built-in KUnit-based KASAN test cases, the test_kasan kernel module does not have test cases for these three memory defects—UMR, UAR, and memory leaks. Why? Simple: KASAN cannot catch these bugs. So, what can we conclude? KUnit (and other) test suites are typically run in an automated fashion, and the expected end result is that all viable test cases pass; in fact, they must pass. If the test suite included these three defects, that would be impossible to achieve, so they are not included. Now, don't get me wrong—this is just how the test suite is designed. Of course, there are definitely other means besides KASAN to catch these defects. Don't worry—we will get there, and we will catch them too.
Here, we are simply showing that KASAN by itself does not catch these specific tricky bugs. Later in the book, we will see which tools can.
By the way, KASAN is a key component in catching hard-to-find bugs through fuzzing methodologies. Syzkaller (aka syzbot)—the de facto powerful Linux kernel fuzzer—requires the kernel to be configured with KASAN! We will briefly introduce fuzzing in the What is fuzzing? section of Chapter 12, A few More Kernel Debug Approaches. Be sure to check it out.
Nice job—you now know how to leverage the power of KASAN to help catch those tricky memory bugs! Next, let's move on to using UBSAN.