7.5 Decoding Kernel Bug Diagnostics (Part 2)
7.5 Leveraging Kernel Scripts — Don't Reinvent the Wheel
In the previous section, we manually traced bugs the hard way, wielding our "trusty trio" of objdump, addr2line, and gdb like hand-written assembly. It's a hardcore, geeky approach, and a necessary one—it builds your low-level understanding of how those hex addresses translate back into filenames and line numbers.
But in real-world engineering, efficiency matters just as much. If you work with the kernel every day, you'll want a more "automated" assistant to take care of all that tedious conversion work.
The modern Linux kernel source tree actually hides quite a few of these "housekeeping scripts." They're like a toolbox left behind by kernel developers for future generations. Open it up, and you'll find that others have already stepped on the same landmines—and even wrote a script to keep you from doing the same.
In this section, we'll lay out these tools and see how they can pull us out of the Oops quagmire.
Tool Overview
Before diving into the details, it's always good to have a map. Table 7.3 lists the key scripts we'll focus on in this section and the specific problems they solve. This isn't an exhaustive list (there are more in the source tree), but these are the "lifelines" you'll want on your debugging journey.
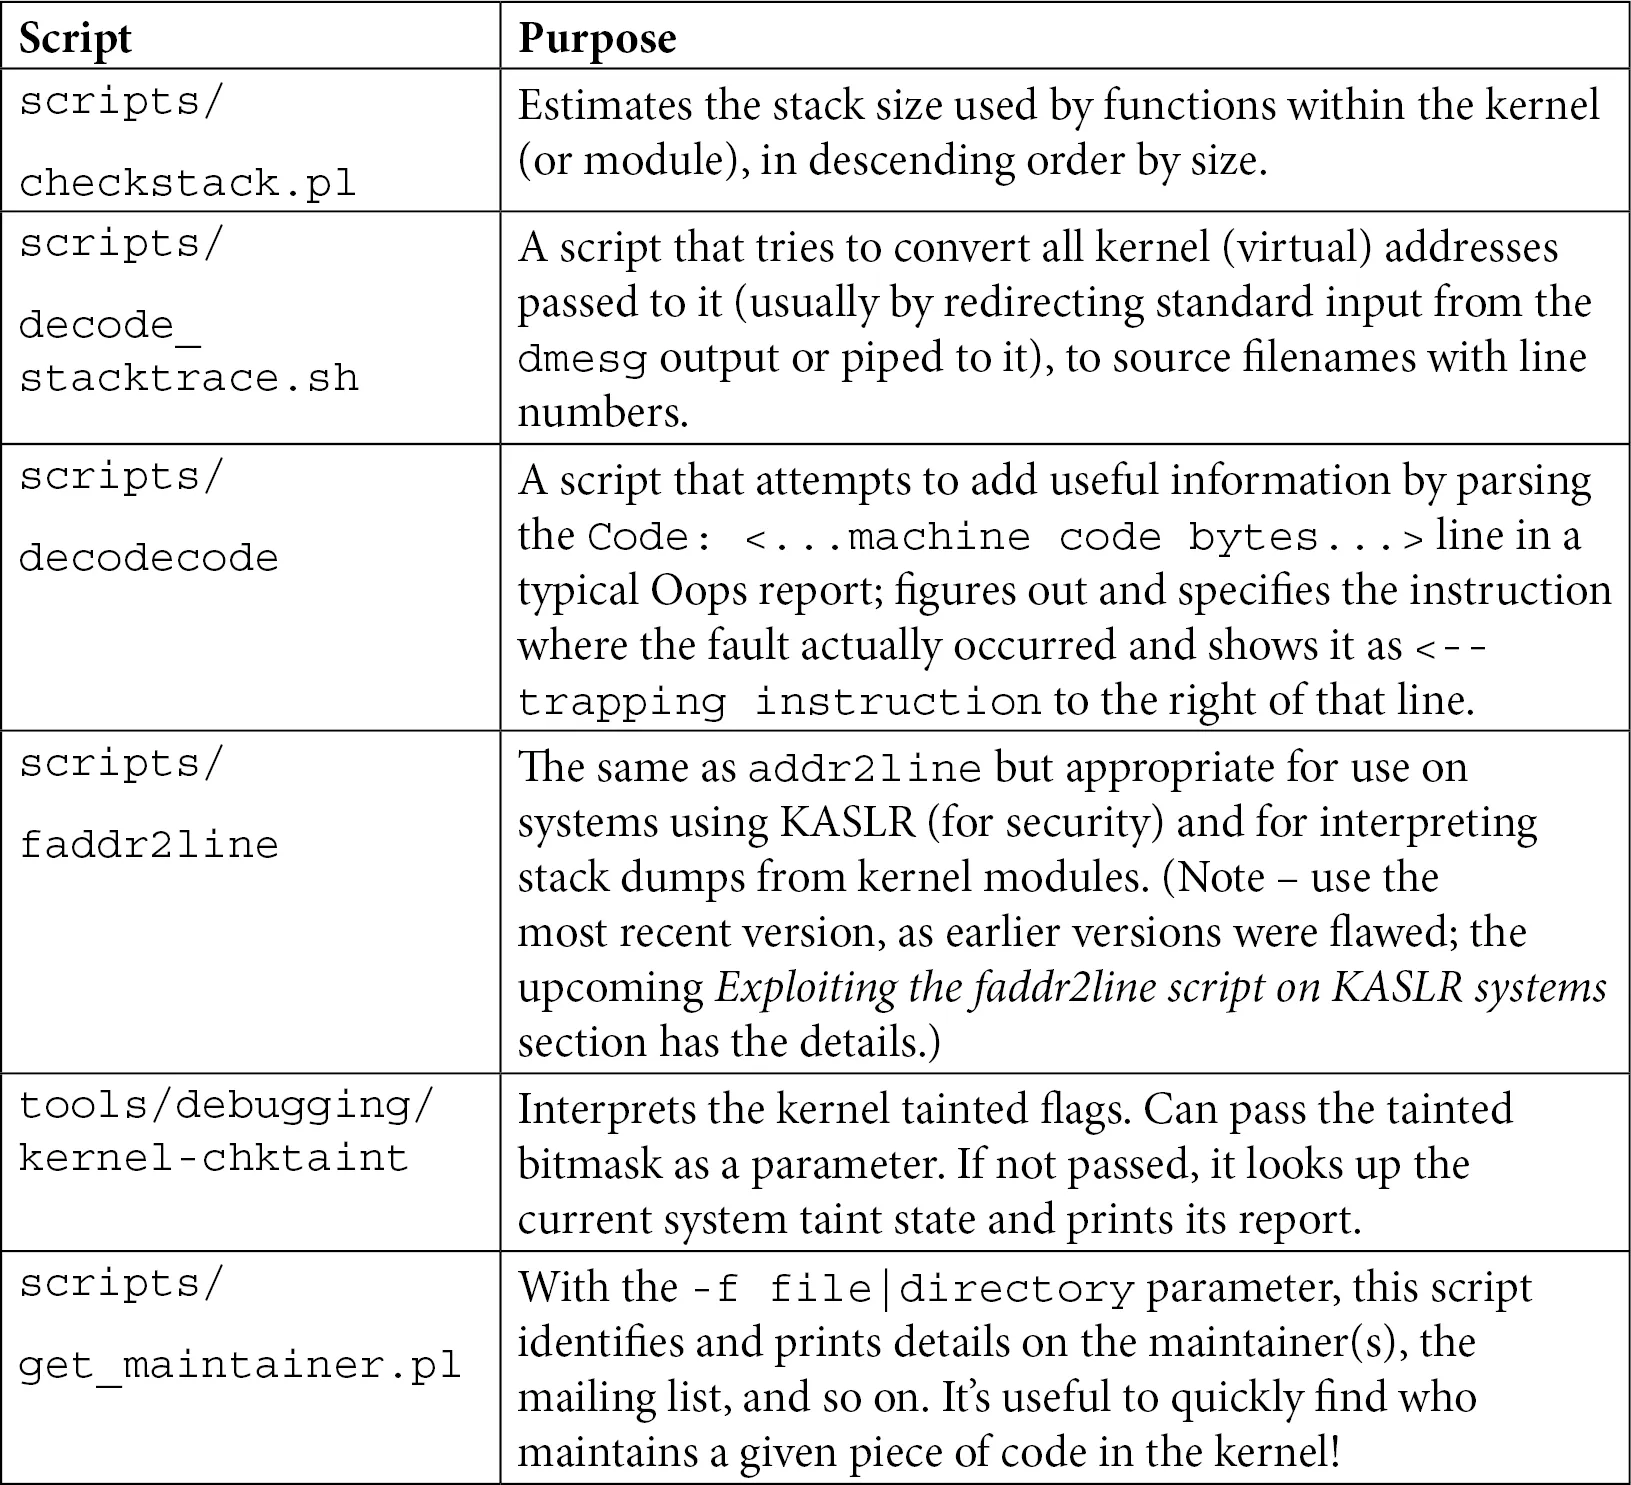
Table 7.3 — Quick Reference for Common Kernel Helper Scripts
Don't bother memorizing this just yet. We'll pick each one up and take it for a spin below to see exactly where it shines.
1. Prevention Over Cure: Using checkstack.pl
Playing with pointers in the kernel is thrilling, but it's also high-risk. Have you ever wondered: how big is the kernel stack?
In user space, a thread's stack can be quite large (typically 8 MB by default), so you can freely allocate large local arrays or dive into deep recursion. But the kernel stack is a completely different beast.
Every user-space thread has two stacks: a large user stack and a small kernel stack. When a system call occurs and the CPU switches to kernel mode, it uses that small kernel stack. Just how small is it?
On 32-bit systems, it's typically 2 pages (8 KB); on 64-bit systems, it's 4 pages (16 KB).
(Note: Don't assume the page size is always 4 KB. While that's usually the case, the kernel uses the PAGE_SIZE macro to determine the actual size.)
What Does This Mean?
It means that if you declare a slightly oversized local array in the kernel, or write an unbounded recursion, a stack overflow can happen all too easily.
Moreover, a kernel stack overflow has very different consequences than a user stack overflow. A user stack overflow will, at worst, crash the current process with a SIGSEGV from the kernel. But a kernel stack overflow will often bring down the entire system—because it might corrupt adjacent critical data structures, causing the system to lock up silently. In those cases, you might not even get an Oops, let alone debug it.
That's why kernel maintainers created a Perl script: scripts/checkstack.pl. It scans your code and calculates the maximum stack space each function consumes.
It's like doing a budget check before building a house—it tells you whether a wall is exceeding its load-bearing limits.
How to Use It?
It's typically used in conjunction with objdump, piping the disassembly output into it:
$ objdump -d <...>/linux-5.10.60/vmlinux | <...>/linux-5.10.60/scripts/checkstack.pl
0xffffffff81000210 sev_verify_cbit [vmlinux]:        4096
0xffffffff81a55430 od_set_powersave_bias [vmlinux]:  2064
0xffffffff817b2410 update_balloon_stats [vmlinux]:   1776
[...]
The output is sorted by stack size in descending order. See how sev_verify_cbit gobbles up 4096 bytes (a whole page!)? Functions like this are prime candidates for monitoring.
Of course, you can also use it to check your own kernel modules:
$ objdump -d /lib/modules/5.10.60-dbg02-gcc/kernel/drivers/net/netconsole.ko \
  | <...>/scripts/checkstack.pl
0x0000000000001380 enabled_store [netconsole]:        224
0x0000000000000000 init_module [netconsole]:          224
0x0000000000000c30 remote_ip_store [netconsole]:      208
[...]
⚠️ Warning: Don't be overconfident A few hundred bytes in your module might look fine, but remember that kernel call chains can be very deep. By the time your function is called, several layers might already be on the stack. A few hundred bytes here and a few hundred bytes there, and you'll quickly hit that 16 KB ceiling.
CONFIG_VMAP_STACK: The Kernel's Last Line of Defense
Given how dangerous kernel stack overflows are, the kernel community naturally came up with a solution. Starting with version 4.9 (x86_64) and 4.14 (ARM64), the kernel introduced a critical configuration option: CONFIG_VMAP_STACK.
Previously, kernel stacks were allocated from contiguous physical memory—if you overflowed, you'd trample on someone else's territory with unpredictable consequences. With this option enabled, kernel stacks are allocated using the vmalloc mechanism.
What does this mean? It means every kernel stack is wrapped in "guard pages." The moment your stack overflows—even by a single byte—it hits a guard page, and the MMU immediately throws a page fault.
While this still causes a kernel crash, it at least guarantees that the crash is controlled—you'll see an Oops instead of a black screen of death. This gives you a chance to debug.
2. Reconstructing the Scene: Using decode_stacktrace.sh
Suppose you have a raw Oops log containing Call Trace, which lists a bunch of function names. But that's not intuitive enough—you really want to know exactly which source code lines correspond to these function calls.
In the previous section, we used addr2line to manually look up addresses. But that's way too slow for an entire call stack. This is where scripts/decode_stacktrace.sh comes in.
You can think of it as a "batch version of addr2line." It can convert all the addresses in a call stack into filenames and line numbers in one go. Under the hood, it's just a wrapper script around addr2line, saving you the trouble of typing out the commands yourself.
Preparation
To get this script working, you need to feed it the right ingredients:
- A
vmlinuxfile with debug symbols: It must be an uncompressed ELF file. - The source code path: The script needs to know where to find the source files (to display line numbers).
- The module path: If the Oops was triggered by a module, you also need to tell it where the module is located.
Hands-On Practice
Let's demonstrate with our old friend, the oops_tryv2 module. Suppose we've saved the Oops log to a file called dmesg_oops_buginworkq.txt.
Make sure your module was compiled with MYDEBUG=y (i.e., with symbol information), and then run:
$ ~/lkd_kernels/productionk/linux-5.10.60/scripts/decode_stacktrace.sh \
   ~/lkd_kernels/debugk/linux-5.10.60/vmlinux \
   ~/lkd_kernels/debugk/linux-5.10.60 ./ \
   < dmesg_oops_buginworkq.txt
Parameter breakdown:
- First parameter: Path to
vmlinux. - Second parameter: Base path of the kernel source (the directory where
vmlinuxis located). - Third parameter:
./indicates the module is in the current directory.
Output Analysis
Let's see what the script spits out:
[...]
[  448.049414] BUG: kernel NULL pointer dereference, address: 0000000000000030
[...]
[  448.049547] Workqueue: events do_the_work [oops_tryv2]

[  448.049562] RIP: 0010:do_the_work (/home/letsdebug/Linux-Kernel-Debugging/ch7/oops_tryv2/oops_tryv2.c:62) oops_tryv2
<< ... output of the decodecode script ... >>
[...]
[  448.049934] Call Trace:
[  448.049949] process_one_work (kernel/workqueue.c:1031 (discriminator 19) kernel/workqueue.c:2194 (discriminator 19))
[  448.049967] worker_thread (./arch/x86/include/asm/current.h:15 kernel/workqueue.c:979 kernel/workqueue.c:1815 kernel/workqueue.c:2381)
[  448.049984] ? process_one_work (kernel/workqueue.c:2222)
[  448.050002] kthread (kernel/kthread.c:277)
[...]
See that? After the previously cold RIP: 0010:do_the_work, it now directly appends (.../oops_tryv2.c:62).
Even better is the Call Trace section. It doesn't just list function names; it prints the call path (file:line_number) for each function in the source code.
For example, worker_thread calls process_one_work, and process_one_work is located at lines 1031 and 2194 of workqueue.c (using GCC's discriminator optimization info, indicating details that might be inlined or macro-expanded).
It's like watching a game replay—not only do you see the goal, but the annotation also tells you "This happened in the 62nd minute, from a right-flank breakthrough and cross." The amount of information is immense.
3. Machine Code Decoder: The decodecode Script
In the previous section's output, you might have noticed this line:
<< ... output of the decodecode script ... >>
This is actually the result of decode_stacktrace.sh calling another script—scripts/decodecode.
Sometimes knowing the line number isn't enough; we want to see exactly which assembly instruction triggered the disaster. That's what decodecode does. It reads the "Code" section from the Oops log (that blob of hex machine code), attempts to disassemble it into readable assembly instructions, and highlights the culprit instruction.
How does it work?
A quick glance at the source of decode_stacktrace.sh reveals the trick:
$ cat <...>/linux-5.10.60/scripts/decode_stacktrace.sh
[...]
decode_code() {
    local scripts=`dirname "${BASH_SOURCE[0]}"`
    echo "$1" | $scripts/decodecode
}
It simply takes the machine code you pass in and feeds it directly to decodecode for processing.
Output Demonstration
Suppose we take the machine code section from when do_the_work triggered the Oops and feed it directly to decodecode. It would spit out something like Figure 7.17:
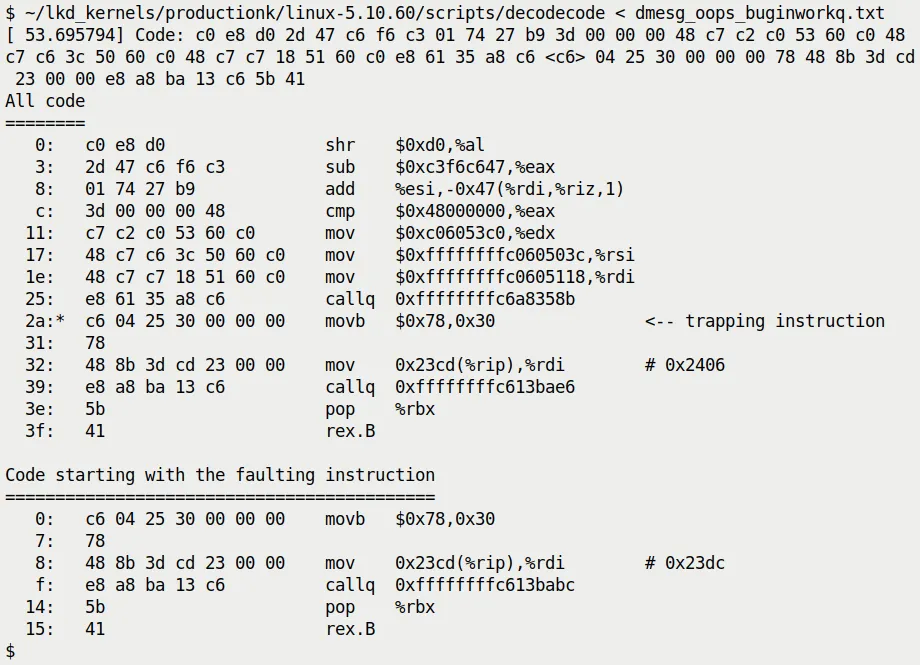
Figure 7.17 — Example output of the decodecode script
Notice the <-- trapping instruction in the output. It precisely points out which assembly instruction caused the MMU to throw an exception.
In this example, a movb instruction is trying to access the address 0x30 (which is the offset of that null pointer in our code). Seeing this line, you can be absolutely certain: this is exactly where the code crashed.
⚠️ Note
decodecode is a veteran tool that was added to the kernel source back in 2007 (kernel 2.6.23). Though rudimentary, when analyzing low-level questions like "which exact instruction crashed," it's often more convincing than a mere source code line number.
4. Bypassing KASLR: The faddr2line Script
Remember the "KASLR curse" we mentioned at the end of the previous section?
Because of KASLR (Kernel Address Space Layout Randomization), the kernel's runtime addresses are randomized on every boot. This means the addresses in an Oops (like do_the_work+0x124) contain a random offset, so looking them up directly in the static symbol table of vmlinux won't work.
In the previous section, we suggested turning off KASLR or using addr2line. But what if you can't reboot the system, or you absolutely must debug with KASLR enabled?
That's when you bring out the scripts/faddr2line script.
How Does It Handle KASLR?
faddr2line is also a wrapper script around addr2line, but it's clever enough to understand the "function name + offset" format (like do_the_work+0x124), and it correctly handles certain quirks of the kernel symbol table during processing.
Give It a Try
Run it directly to see the usage:
$ <...>/linux-5.10.60/scripts/faddr2line
usage: faddr2line [--list] <object file> <func+offset> <func+offset>...
Suppose our Oops occurred in do_the_work+0x124:
$ ~/lkd_kernels/productionk/linux-5.10.60/scripts/faddr2line \
   ./oops_tryv2.ko do_the_work+0x124
bad symbol size: base: 0x0000000000000000 end: 0x0000000000000000
Huh? An error!
Pitfall Warning: A Bug in Older Versions
If you're using an older kernel version (like 5.10.x), you'll hit this landmine. This is actually a bug in the faddr2line script itself.
The root cause is quite low-level: internally, the script uses the nm tool to look up symbols, but nm isn't robust enough when handling certain special symbol information. The script maintainer, Josh Poimboeuf, fixed this issue in May 2022 by swapping out the underlying tool for the more powerful readelf.
So, if you see the error above, you have two options:
- Upgrade your kernel: Use a version after 5.19, where this issue is already fixed.
- Apply a patch: Manually apply Josh's commit to your current
scripts/faddr2linefile.
Verifying the Fix
Assuming we use the fixed script, let's run it again:
$ <...>/scripts/faddr2line ./oops_tryv2.ko do_the_work+0x124/0x15e
do_the_work at <...>/Linux-Kernel-Debugging/ch7/oops_tryv2/oops_tryv2.c:62
Perfect! Even though KASLR hides the base address, as long as we know the "relative offset within the function," faddr2line can pinpoint the exact source code line—line 62, which is where that fatal oopsie->data = 'x'; lives.
5. Checking for "Taint": The kernel-chktaint Script
We previously explained the Kernel tainted flag in detail (those letters like G, O, E).
When debugging on a production machine or a complex test rig, it's easy to lose track of exactly which unofficial modules are loaded. In such cases, the tools/debugging/kernel-chktaint script is a handy helper.
It directly reads the value of /proc/sys/kernel/tainted and translates that obscure bitmask into plain English.
Run it:
$ ./tools/debugging/kernel-chktaint
(Figure 7.18 shows an example output; it lists which taint bits are set and explains why, such as "Proprietary module was loaded".)
Although this script is simple, running it once before sending a bug report to kernel maintainers can save you from being immediately rejected because your "kernel is tainted."
6. Finding the Experts: The get_maintainer.pl Script
Finally, what do you do when you've exhausted all debugging options?
There's an old saying: when you can't figure it out, read the source; when you've read the source and still can't figure it out, find the person who wrote it.
The Linux kernel is one of the largest collaborative open-source projects in the world. Almost every piece of code has a maintainer and a dedicated mailing list. But the question is: do you know who to look for?
Don't guess—use scripts/get_maintainer.pl.
Example: KGDB Broke
Suppose you're tinkering with the kernel's KGDB (kernel debugger) feature and run into a baffling issue. You want to ask on the mailing list but are afraid of posting to the wrong place and getting flamed.
In that case, head to the root of the kernel source tree and run:
$ ./scripts/get_maintainer.pl -f kernel/debug/
Or specify the file directly:
$ ./scripts/get_maintainer.pl -f kernel/debug/gdbstub.c
The script will magically spit out a bunch of information (see Figure 7.19):
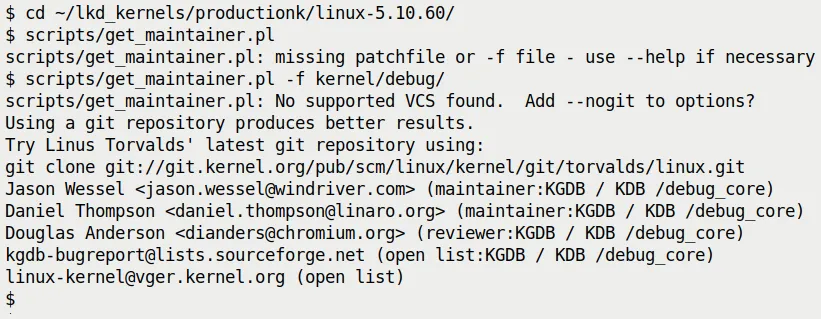
Figure 7.19 — Example output of get_maintainer.pl
It tells you:
- Who the maintainers are: Jason Wessel, Daniel Thompson...
- What the mailing list is:
kgdb-bugreport@lists.sourceforge.net - The relevant code paths:
kernel/debug/
This is essentially your ticket in. Write a clear email describing the problem (remember to attach the Oops log!), send it to that mailing list, and you can be sure the information will reach the people who actually understand this code.
How the Script Works
There's no dark magic here. It simply parses the MAINTAINERS file in the root of the kernel source tree.
This file is a massive text database that records the person in charge of each subsystem. You could, of course, manually grep:
$ grep -A15 -w "KGDB" MAINTAINERS
KGDB / KDB /debug_core
M:   Jason Wessel <jason.wessel@windriver.com>
M:   Daniel Thompson <daniel.thompson@linaro.org>
R:   Douglas Anderson <dianders@chromium.org>
L:   kgdb-bugreport@lists.sourceforge.net
S:   Maintained
W:   http://kgdb.wiki.kernel.org/
T:   git git://git.kernel.org/pub/scm/linux/kernel/git/jwessel/kgdb.git
F:   Documentation/dev-tools/kgdb.rst
[...]
F:   kernel/debug/
But get_maintainer.pl is smarter—it cross-references the Git history to see who has recently modified these files the most, giving you a more accurate recommendation.
Final Thoughts
The scripts in the kernel source tree go far beyond what we've covered here. You can run ls scripts/check* and take a look; you'll find checkpatch.pl (for checking code style), checkversion.pl, and plenty more.
There are also tools like scripts/extract-vmlinux, specifically designed to extract vmlinux from compressed images, or the third-party kdress tool.
These are the trees planted by our predecessors, and we get to enjoy the shade.
With the knowledge from this section, you no longer have just a single "debugging hammer" in your hand. From stack overflow prevention and address resolution to machine code reconstruction and finally finding the right maintainer, you now have a complete toolchain.
Next, if you're ready, we can dive into some real-world, hair-pulling Oops cases.