ch06_3
Now we reach the validation phase—we throw those problematic test modules into the kernel and see if the security checkpoint we just configured can actually catch the vulnerabilities.
6.3 Running and Analyzing SLUB Test Cases
All the test code is packed into a single module: ch5/kmembugs_test/kmembugs_test.c (don't forget its partner, debugfs_kmembugs.c). Since this section focuses on SLUB, we'll only run the cases related to slab memory.
To clearly see the difference, we'll compare two extreme environments:
- Debugging completely disabled:
slub_debug=- - SLUB debugging fully enabled:
slub_debug=FZPU
You might ask, why run both? Why not just enable debugging and call it a day?
The reason is simple: real-world distribution kernels (like the Ubuntu 20.04 LTS used here) have CONFIG_SLUB_DEBUG=y enabled by default, but that doesn't mean all debugging features are actually running. We need to understand the difference between "having the debugging framework" and "actively debugging with it."
There's also a practical reason: if we test with the debug kernel we compiled earlier with KASAN and UBSAN, those two will jump in and report the errors first—leaving us unable to see SLUB's own reports. So here, we use a clean production kernel (5.10.60-prod01) to let SLUB take center stage.
Scenario 1: SLUB Debugging Disabled (slub_debug=-)
First, let's remove the safety net and see what running bare looks like. This corresponds to the third column in Table 6.2, as well as the rows marked [V1], [V2], and [V3].
The results are exactly as dismal as you'd expect:
-
No response at all: When
slub_debug=-, no memory bugs are caught—including our first three tests (UMR uninitialized memory read, UAR use-after-free, and memory leak), which all slip through the net. -
[V1]unpredictable behavior: The system might directly Oops, freeze up, or appear completely fine—but that last outcome is the most terrifying. Once the kernel is corrupted, it's corrupted, even if it hasn't crashed yet. -
[V2]the fate of double-free: For the double-free defect, an ordinary vanilla kernel or production kernel will actually react. It might trigger a segmentation fault and throw an error like this:kernel BUG at mm/slub.c:305!Here, the instruction pointer register (RIP on x86_64) points right at the
kfree()API.This error message is quite interesting. I specifically looked up the source code for mainline kernel version 5.10.60 (using Bootlin's source browser, which is incredibly smooth):
mm/slub.c:305.Take a look:
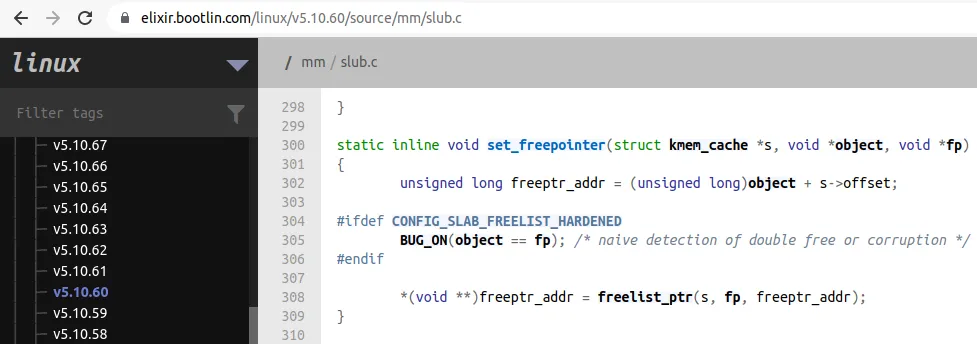
Right on the money. The bug triggers exactly at line 305. This shows that even a plain vanilla kernel retains a last shred of sanity—it can detect this "raw" double-free and recognize it as memory corruption.
-
[V3]UMR remains invisible: As for uninitialized memory reads (UMR) on slab memory, in a production kernel withslub_debug=-, it still flies under the radar. The region returned by kmalloc might appear to be initialized to0x0, but that's just an illusion—you're reading dirty data, and the system isn't warning you.
Scenario 2: SLUB Debugging Enabled (slub_debug=FZPU)
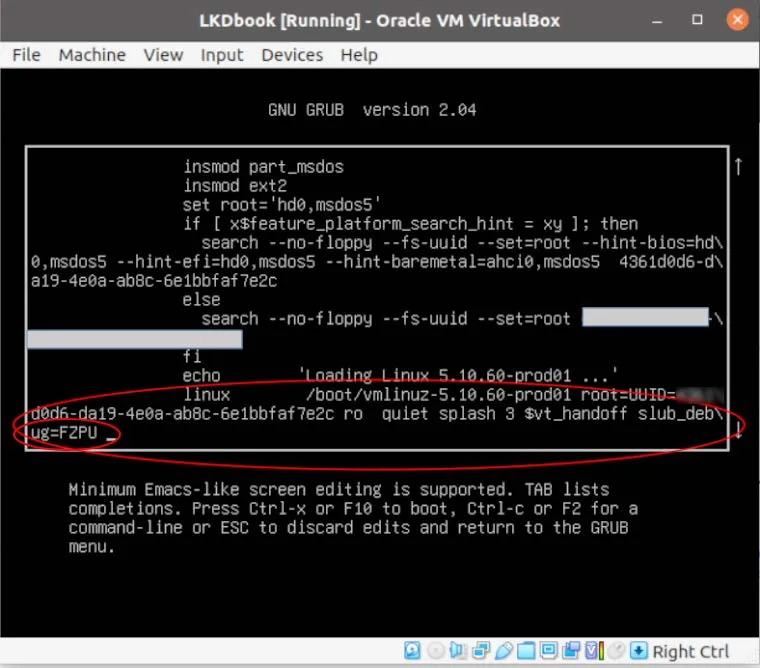
Alright, now let's pull the safety net back up. We need to reboot the system and change the kernel parameter to slub_debug=FZPU in GRUB.
This corresponds to the fourth column in Table 6.2.
If you're working through VirtualBox or directly on physical hardware, editing the GRUB boot entry looks something like this:
After making the change and rebooting into the system, the first step is always to confirm that the kernel actually received your instruction. Don't be lazy—this is a must-check:
$ dmesg |grep "Kernel command line"
[    0.094445] Kernel command line: BOOT_IMAGE=/boot/vmlinuz-5.11.0-40-generic root=UUID=<...> ro quiet splash 3 slub_debug=FZPU
See the slub_debug=FZPU at the end?
(Of course, running cat /proc/cmdline shows the same result.)
Alright, everything is in place now. Let's throw the test modules back in.
This time, the situation completely changes. Look back at Table 6.2 at the rows marked [V4]:
The SLUB debugging mechanism successfully catches out-of-bounds writes (OOB)—whether overflowing upward or downward, neither can escape detection.
But there's a subtle point worth noting—if you look closely at the test results, you'll notice that SLUB's behavior is somewhat similar to UBSAN's: it seems only sensitive to "incorrect index out-of-bounds" access. When the out-of-bounds access happens through pointer arithmetic, it might miss it. Additionally, for out-of-bounds reads (OOB Read), SLUB also seems powerless under this configuration.
This is perfectly normal. No single tool offers a god's-eye view; they all have their own blind spots.
Now, SLUB has caught the culprits and spit out a pile of error logs. Next, we need to learn a core skill: how to read this SLUB error report like a detective.